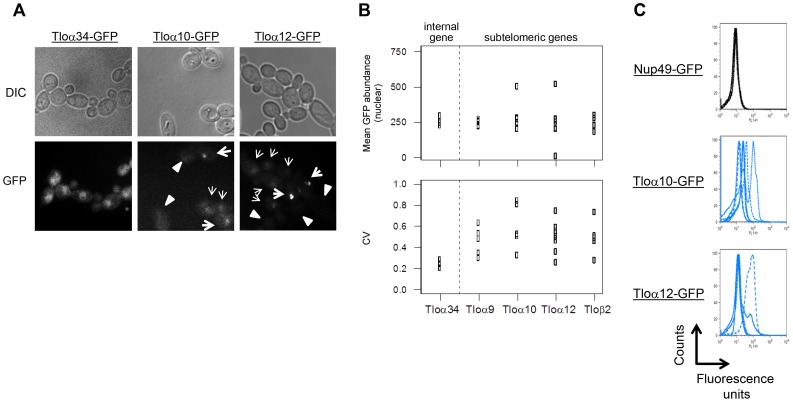
Figure 4. Subtelomeric TLOs exhibit cell-to-cell variance.
(A) Tloα34, Tloα10, and Tloα12 tagged with GFP at the C-terminus were imaged to determine nuclear signal intensity of single cells. (B) Mean nuclear abundance of single cells GFP tagged at five Tlos was quantified using images as collected in (A). Mean GFP abundance of Tlos was similarly variable to the chromosome internal Tlo, Tloα34. However, variation of GFP abundance among single cells in a single replicate was greater for subtelomeric Tlos than Tloα34. At least four replicates were performed for each strain. (C) Flow cytometry profiles of Nup49, Tloα10, and Tloα12 tagged with GFP indicate the expression noise of cell within each population. An overlay of at least four experiments is shown.

