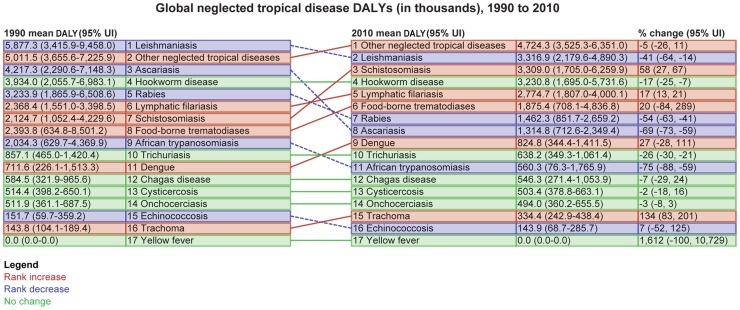
Figure 2. Global trends in DALYs from NTDs, 1990 to 2010.
*Estimation of percent (%) change is not from the means. Each metric in this figure is estimated on 1000 times in the modeling process, and then causes that have a high degree of uncertainty in their draw estimates can have skewed % change results. Abbreviations: UI, unit interval.

