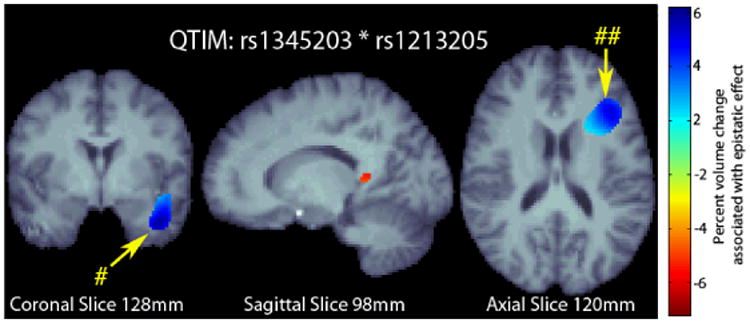
Fig. 2.

3D maps of percent tissue change for each additional genetic variant in the interaction in QTIM. Only significant regions are shown after correcting for multiple comparisons with searchlight FDR [25] at a 5% false discovery rate. Images follow radiological orientation. The origin is placed at the Posterior-Right-Inferior corner. Cooler colors over the tissue represent tissue expansion (larger regional brain volume) compared to an average template. There is a clear protective effect of the epistatic loadings in the left temporal (# in the figure) and along the boundary of the frontal and occipital lobes (## in the figure): as the number of alleles a subject has increases, the amount of local brain tissue they have is also increased on average.
