
Figure 6. Loss of long-distance functional connections in AD.
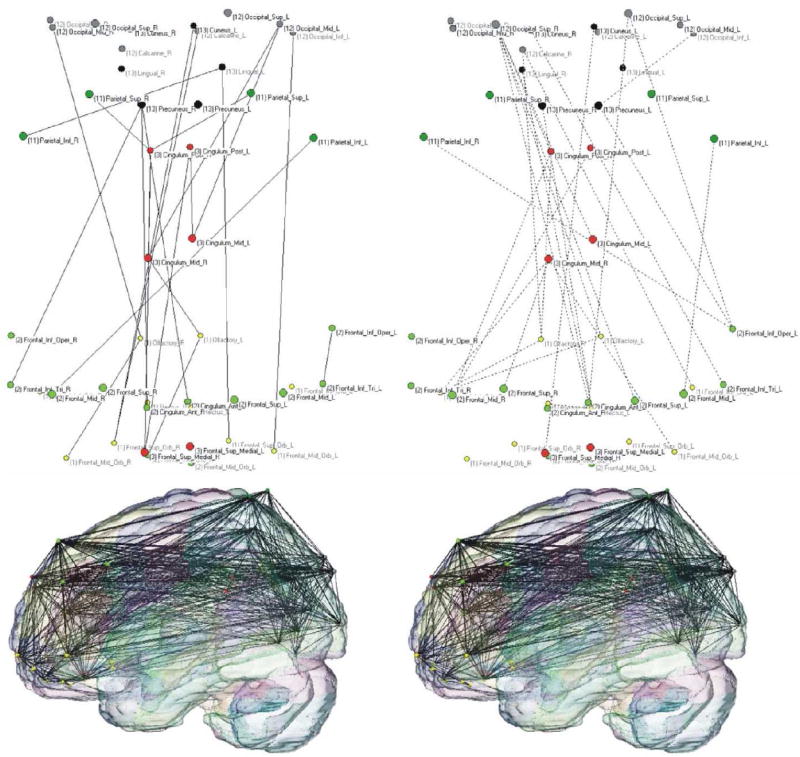
Connectivity pattern of AD and healthy groups (left and right panels, respectively). Color-coded vertices correspond to individual AAL ROIs included in the orbital (yellow), medial (red) and dorsolateral frontal regions (light green), parietal (deep green) and occipital lobes (gray), the cuneus and lingual cortices (black). The upper 2-dimensional graphs (orientation: front-down and left-right) represent the changes in functional connections: solid lines (left) correspond to increases and dashed lines decreases in connectivity in AD (right). Lower figures (orientation: front-left) represent the projections of AD (right) and healthy networks (left) embedded in a 3-dimensional AAL brain template. The graphs demonstrate a net loss of long-distance fronto-parietal and fronto-occipital functional connections (for both groups, T = 0.05; K = 10). Reprinted with permission from Sanz-Arigita et al., 2010.