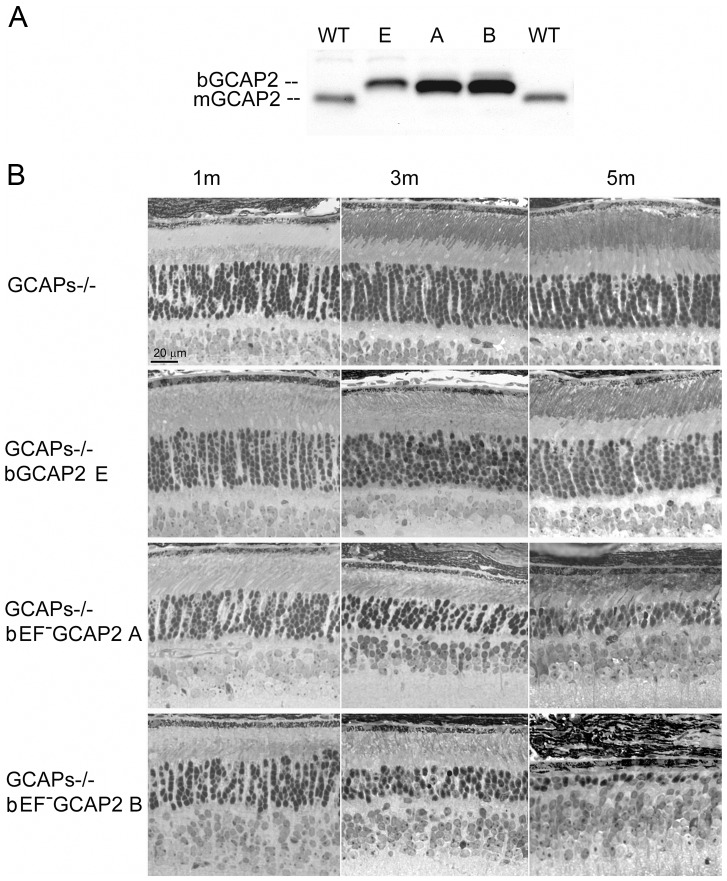
Figure 2. Transgenic expression and rate of retinal degeneration in the GCAPs−/− background.
A. Levels of transgene expression in the GCAPs−/− background in mouse retinas from line E (ctrl bGCAP2) and lines A, B (bEF−GCAP2). Equal fractions of the retina were loaded from mice at 30 d of age. Transgene expression levels estimated in the GCAPs+/+ background were maintained in the GCAPs−/− background. B. Light micrographs of retinal sections from mice of the indicated genotypes at 1, 3 and 5 months of age, standard cyclic light rearing. Lines A and B show a progressive retinal degeneration in the GCAPs−/− background, that reduces the ONL thickness to 4–5 rows of nuclei at three months, and to 3 rows at five months (line A) or to a single row by five months of age (line B).

