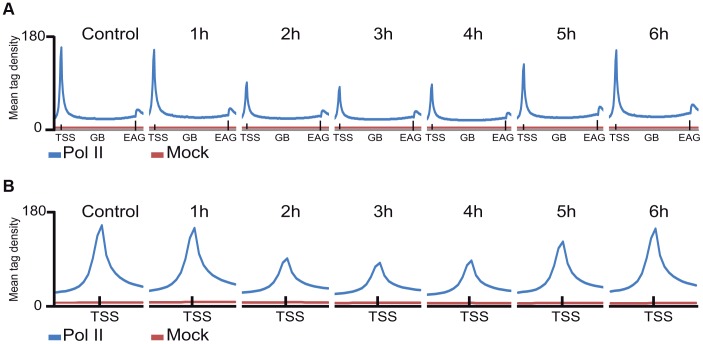
Figure 2. The average Pol II profile changes after UVB irradiation at all refseq genes.
ChIP-seq was carried out using the anti-Pol II antibody (N-20) on human MCF7 cells 1–6 hours after UVB irradiation and on non-treated cells and the corresponding data sets were generated. Average Pol II profiles were calculated for every refseq gene from −1 kb region in front of every transcription start site (TSS), including the gene bodies (GBs), until +4 kb downstream from the 3′ end of annotated genes (EAGs) for all the time points (A) and −1 kb and +1 kb the around TSSs of every refseq gene (B). TSSs (in A and B) and EAGs (in A) are labeled. Pol II ChIP-seq signals are represented in blue and the mock ChIP-seq signals in red. The Y axis shows mean tag densities. Data sets obtained from irradiated cells harvested at the indicated time points in hour (h) after UVB irradiation together with the non-irradiated (Control) cells are represented.

