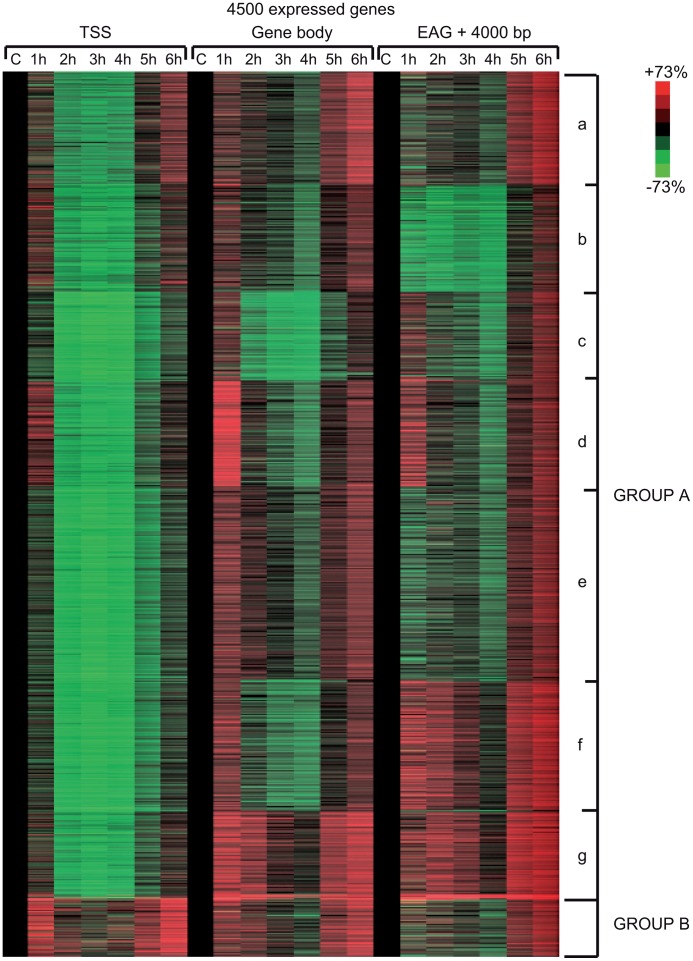
Figure 4. Different Pol II behavior patterns in time after UVB irradiation on 4500 expressed genes.
From the ChIP-seq datasets heat maps were generated to follow Pol II behavior in time on the 4500 expressed genes at different genomic regions after UVB treatment in MCF7 cells. Tag numbers were calculated and visualized around the TSS (−/+300 bp), on the gene body (−100 bp from TSS until EAG) and downstream from EAG (from EAG to EAG+4 kb) of each gene. To be able to uniformly follow and represent the diverse Pol II occupancy changes on thousands of genes, the calculated Pol II reads at the different regions of different genes (as indicated) were converted into percentage values, where the control non-UVB treated values represent 100% reads (black color code) and the Pol II read alterations are either represented as % loss (green color) or as % gain (red color code). Each horizontal line represents one gene. The intensity of the color on the heatmap represents the magnitude of the Pol II tag number alteration (max −/+73%). Black color also refers to the lack of Pol II density change. In addition, genes were sorted into distinct groups and subgroups (Group Aa-Ag and Group B) based on the Pol II tag density values and patterns by using k-means clustering. Different time points following UVB irradiation are labeled at the top of the panels in hour (h). C = control, non-irradiated data set. For individual genes see Figure S3.

