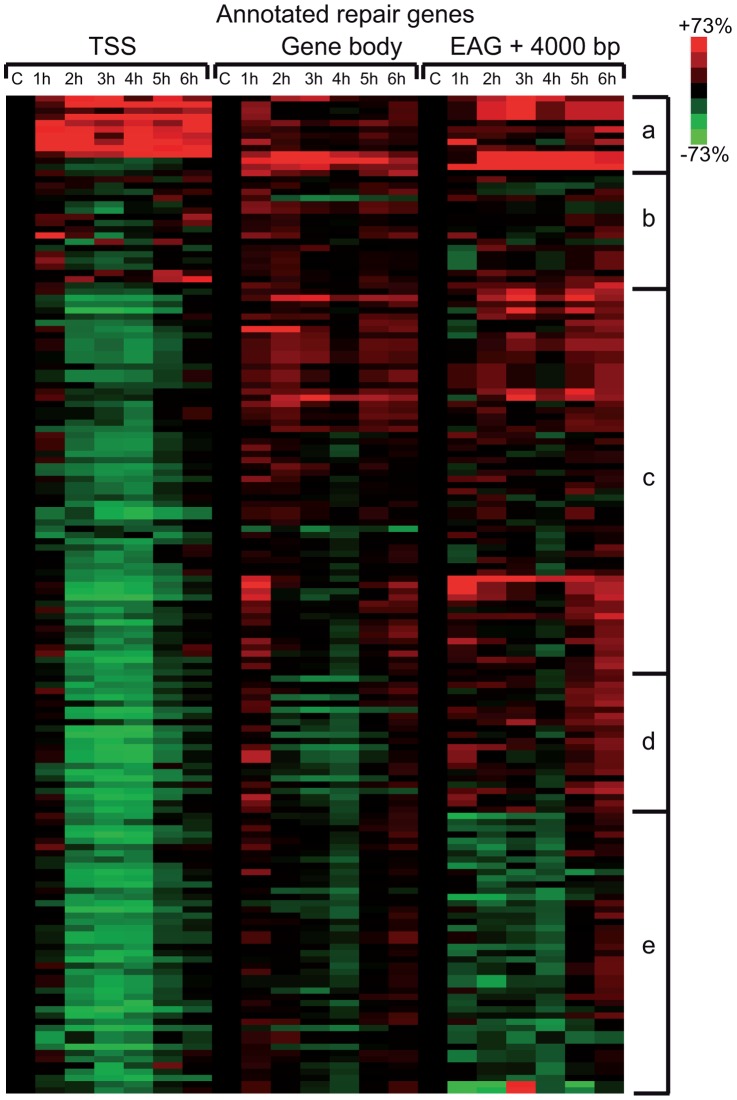
Figure 5. Pol II behavior on annotated DNA damage repair and UV responsive genes after UVB irradiation.
Pol II reads were calculated around the TSS (+/−300 bp), on the gene body (−100 bp from TSS until EAG) and downstream from EAG (from EAG to EAG +4 kb) for well characterized DNA repair and UV responsive genes (from the KEGG database) from each ChIP-seq dataset. From the collected values heat map was generated, and genes are organized into groups based on similar Pol II behavior by using k-means clustering. Pol II occupancy changes are represented as in Figure 4. Red color shows increased; green color shows decreased Pol II tag numbers in percentages compared to data obtained from the control non-UV irradiated cells (black color). Black color also refers to no change in Pol II density. The figure is labeled similarly as Figure 4.

