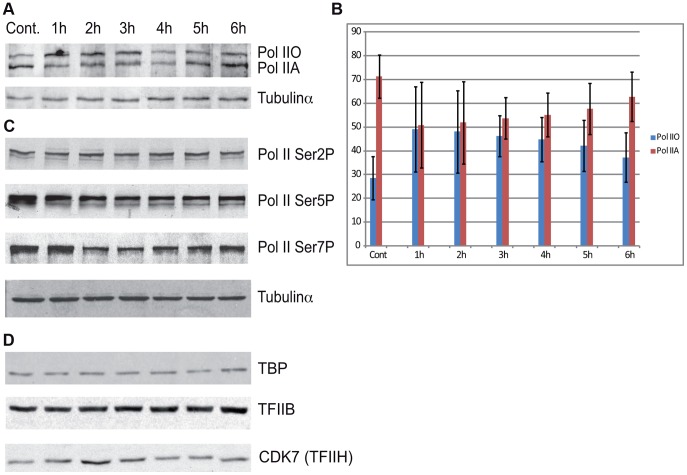
Figure 6. The protein level of Pol II and GTF subunits does not change after UVB treatment.
(A) Western blot assays were carried out to measure the levels of total Pol II at the indicated time points after UVB treatment by using the N-20 antibody. (B) The different IIA and IIO forms of Pol II were densitometrically quantified in each time points from four independent experiments and are represented in a bar chart, where red bars indicate Pol IIA and the blue bars indicate Pol IIO forms. In each lane Pol IIA+IIO signals are taken as 100%. Error bars represent +/− standard deviation of the four independent experiments. (C) The phosphorylation levels of Pol II Rpb1-CTD Ser2, Ser5 and Ser7 were analyzed by western blot by using the indicated antibodies, respectively. (D) The levels of the indicted GTF subunits such as TFIIB, TBP and TFIIH/CDK7 were also tested in the above prepared extracts, as indicated. Tubulin-α was used as a loading control.

