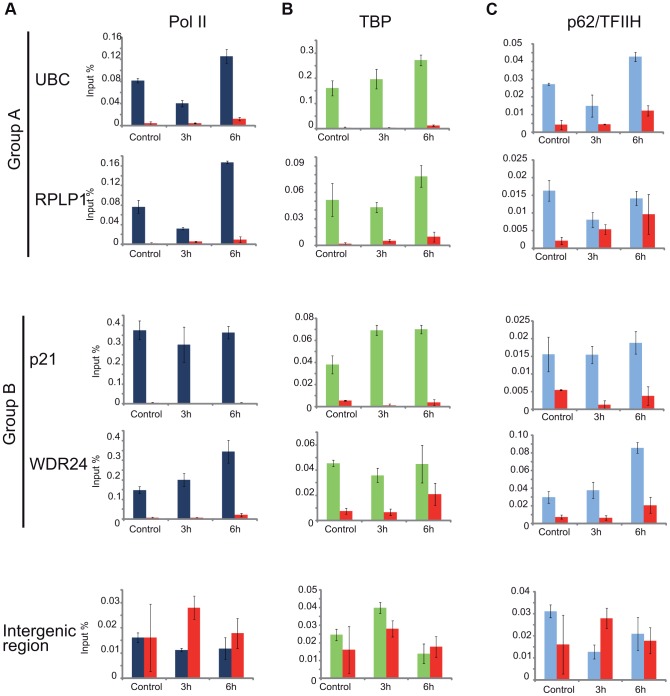
Figure 7. ChIP-qPCR validation of Pol II and PIC subunit behavior on promoters of group A and B genes.
ChIP was carried out 3 and 6-treated cells and analyzed by quantitative (q)-PCRs to monitor Pol II (dark blue bars) (in A), TBP (green bars) (in B), p62 (light blue bars) (in C) occupancy on the promoters of genes selected from group A (ubc, rplp1), group B (p21, wdr24) and on a negative control (intergenic) region, as indicated. Control ChIP (NoAb, red bars) was carried out with Sepharose G beads only. The occupancy values at the promoters are represented in input %. Error bars represent +/− standard deviations.

