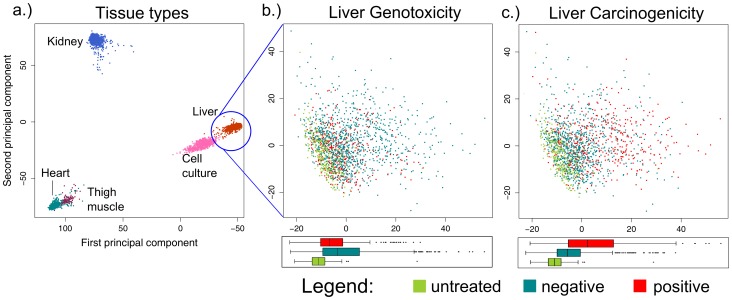
Figure 1. Principal component analysis (PCA) of the DrugMatrix.
a) The first two principal components of all samples in the DrugMatrix dataset. b) Liver samples with color coding for controls, samples treated with genotoxic or non-genotoxic samples. c) Liver samples with color coding for carcinogenicity.

