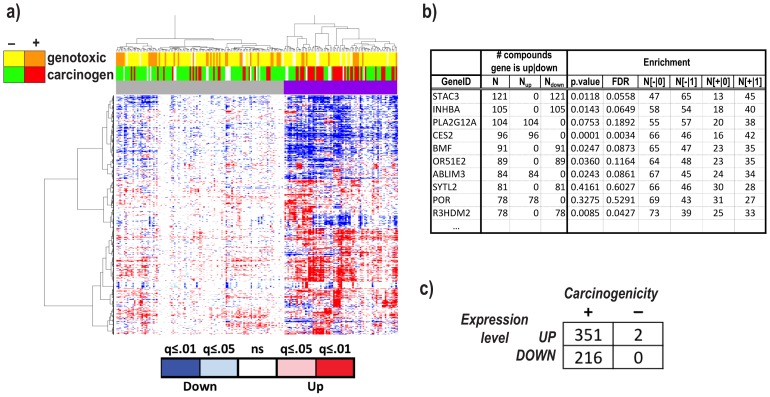
Figure 2. Defining the carcinogenome.
a) Hierarchical clustering of 191 profiles/138 compounds (columns) and genes (rows), with each compound represented by the vector of ‘treatment vs. control’ differential expression t-scores. The heatmap is color-coded according to the significance level (q-values) of the corresponding t-scores. Notice the right cluster (top purple color bar) and its enrichment in carcinogenic (red) compounds (Fisher test p = 8.5×10⁻⁶). b) Top 10 genes ranked according to the number of compounds inducing their significant up-/down-regulation (FDR≤0.01 and fold-change≥1.5. See complete list in Table S28 in File S2). Each gene was also tested for its association with carcinogenicity across compounds (‘Enrichment’ columns) by performing a Fisher test between the gene status (0: not differentially expressed; 1: differentially expressed) and the compounds' status (+ = carcinogenic; − = non-carcinogenic). c) Contingency table detailing the distribution of the genes whose compound-induced up-/down-regulation pattern is significantly associated with carcinogenicity status of the compounds.

