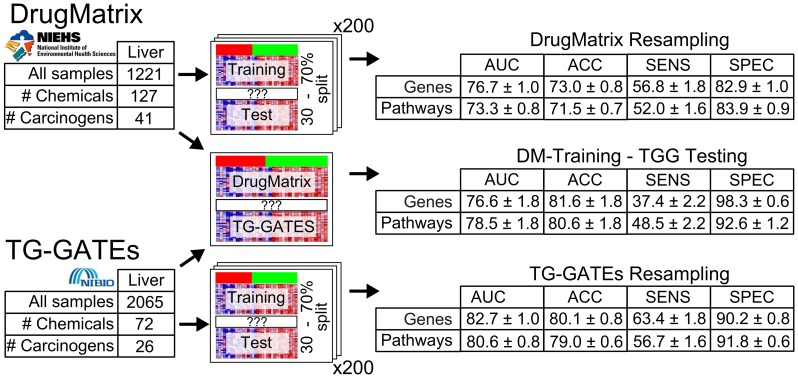
Figure 3. Classification results overview.
Random resampling classification results on the DrugMatrix (top) as well as the TG-GATEs (bottom) datasets using 200 iterations. In addition, the results of a model trained on all DrugMatrix samples and tested on TG-GATEs (middle) are shown. Results based on the regular gene expression data and on the data projected onto pathway space (canonical pathways of MSigDB – C2:CP, see Methods) are reported. For each testing scheme, area under the receiver operating characteristic (ROC) curve (AUC), as well as accuracy, sensitivity and specificity of a classifier trained with a zero-one loss function (FP:FN = 1∶1), and 95% confidence intervals are reported.

