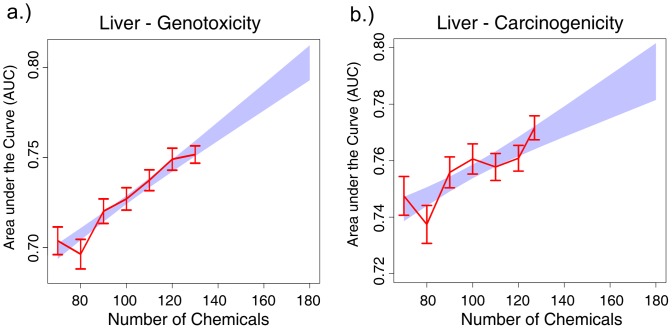
Figure 5. Classification learning curves as a function of the number of chemicals for: a) genotoxicity and b) carcinogenicity in liver.
The actual AUC values are in red and include the 95% confidence interval for each value. The predicted values of a fitted linear regression model are shown in blue.

