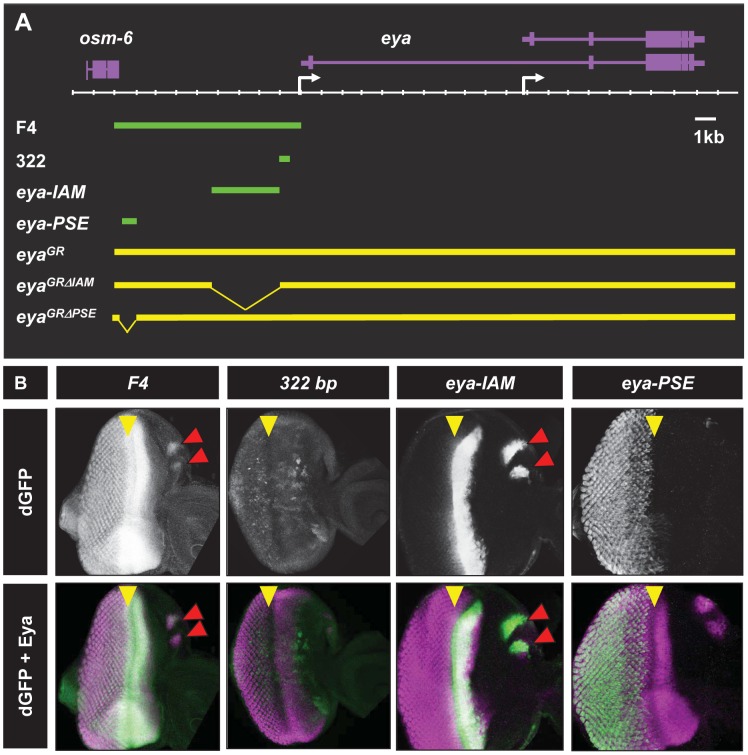
Figure 1. Identification of two new cis retinal enhancers of eya.
A. Schematic of the eya locus showing enhancer fragments and genomic constructs. Genes (purple) are shown above the scale while the enhancer fragments (green bars) and genomic constructs (yellow) are on bottom. Transcription start sites are indicated by white arrows. B. Third instar eye discs showing enhancer-driven dGFP expression (white in top panels and green in bottom panels) along with endogenous Eya expression (magenta in bottom panels). Yellow arrowheads indicate the position of the MF and the red arrowheads mark ocellar dGFP expression in eya-IAM animals.

