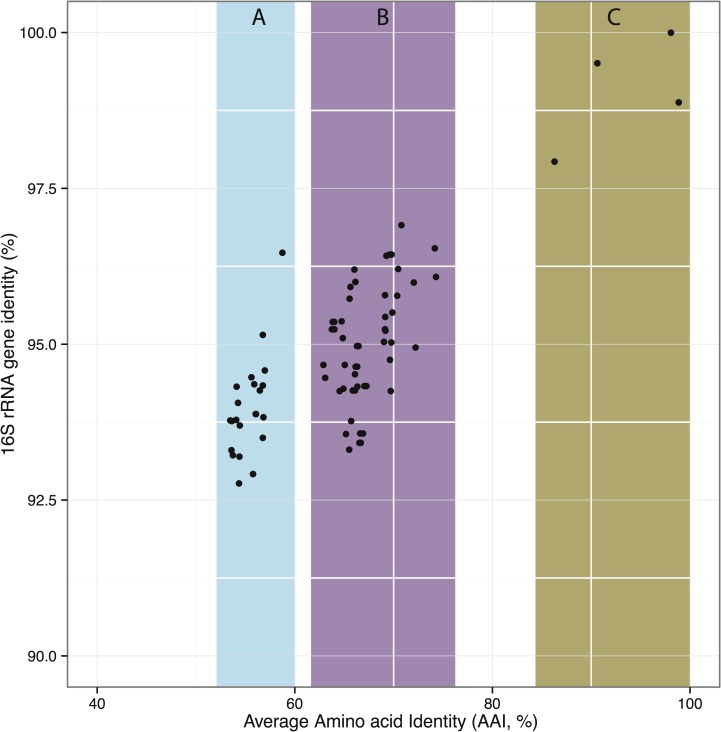
Figure 2. Relationships between 16S rRNA sequences and AAI for the new strains described here and the formally described Methylophilaceae.
Each dot represents a comparison between two genomes and shows their 16S rRNA gene identity (y-axis) plotted against the AAI of the genes shared between the two genomes (x-axis). Highlights show (A) unambiguous separation of the marine strains from the terrestrial Methylophilaceae; (B) poorly resolved relationships among terrestrial Methylophilaceae, the dots in the range AAI 62.9–67.3 representing pairs of different named genera, and dots in the range AAI 69.0–74.3 representing pairs at ranks of both genera and species, (C) unambiguous separation of pairs belonging to the same species. A total of 14 genomes were included in this analysis.

