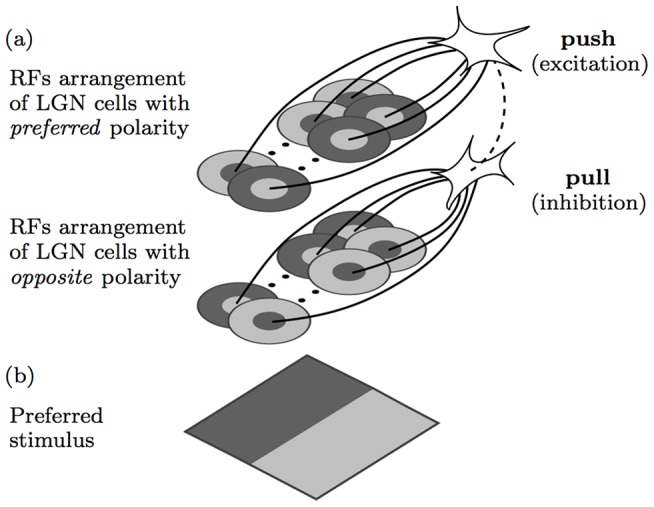
Figure 1. Model of push-pull inhibition.

(a) Model of a (top) simple cell that receives excitatory or push input from model LGN cells with appropriately aligned receptive fields, and an inhibitory or pull input from another (bottom) cortical neuron that receives input from LGN cells with receptive fields of opposite polarity. Shaded light and dark gray areas indicate ON and OFF subregions, respectively, within the receptive fields of afferent model LGN cells. The solid lines indicate excitatory synaptic connections and the dashed line indicates an inhibitory synaptic connection. (b) Preferred stimulus that evokes maximum response to the concerned model.
