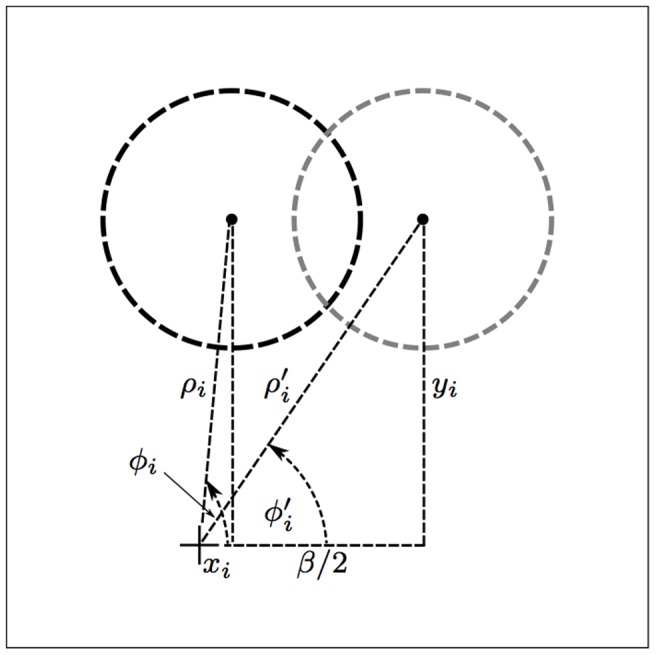
Figure 3. Automatic adjustment of a CORF receptive field for a given β value.

The black and gray dashed circles represent the original and the shifted receptive field, respectively, of a center-off sub-unit that is described by tuple i in the concerned CORF model. The new polar coordinates ( ), with respect to the ‘+’ marker (receptive field center of the CORF model at hand), are determined by shifting the polar coordinates (
 ) along the x-axis by half of the given β value.
