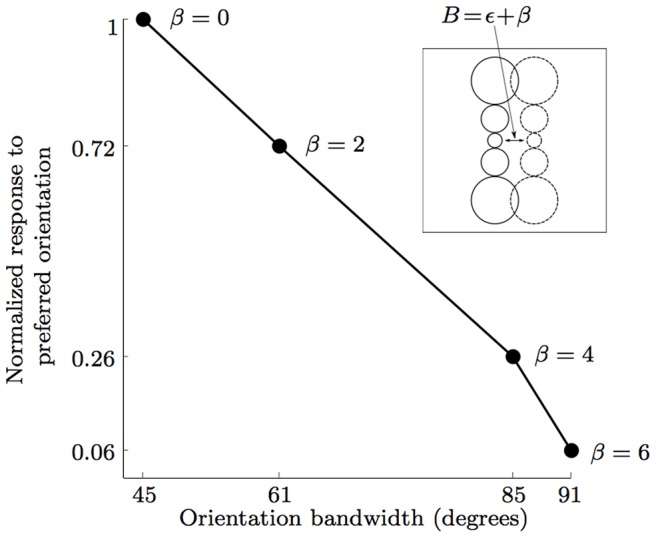
Figure 4. Relationship between the separation index B of the ON and OFF subregions of the receptive field of a CORF model cell (see inset) and the response to the preferred oriented edge and the orientation bandwidth at half amplitude.

For β = 0 the ON and OFF sub-regions are organized as depicted in Fig. 2a. In this case, the concerned CORF model cell achieves maximum response with an orientation bandwidth at half amplitude of 45°. The orientation bandwidth increases and the response decreases with an increasing β value. The value of β for which the response disappears depends on the size of the pool - if it does not touch the edge, there will be no response.
