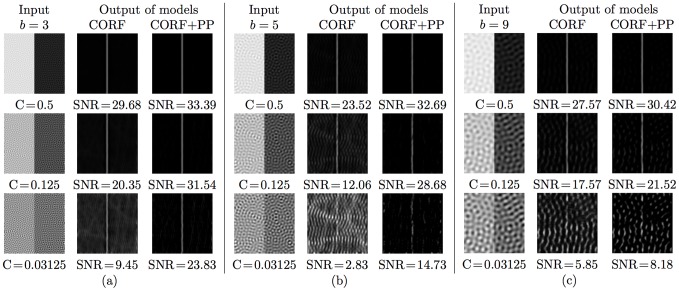
Figure 6. Experimental results of the SNR obtained with CORF model cells with no inhibition (CORF) and with push-pull inhibition (CORF+PP).
The first columns of (a–c) contain test images that are obtained by varying the spatial wavelength w and the contrast value C of band-limited noise. The second and third columns of (a–c) are the response maps obtained by the concerned CORF and CORF+PP model cells, respectively. A CORF model cell with push-pull inhibition systematically exhibits an improved SNR.

