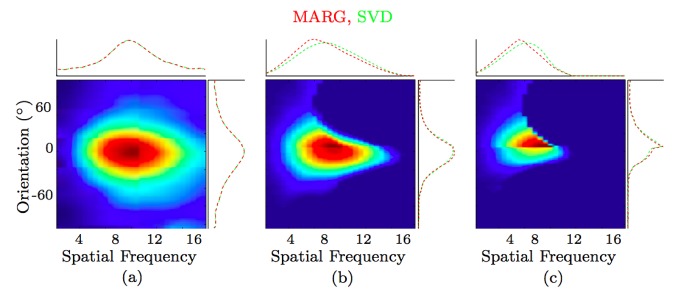
Figure 7. Separability of spatial frequency and orientation.
(a) Response maps of a CORF model cell without inhibition ( ,
,  ), to gratings of different spatial frequency and orientation, (b) with moderate push-pull inhibition (
 ,
,  ) and (c) with strong inhibition (
 ,
,  ) The red and green plots indicate the marginal (MARG) row- and column-wise sums, and singular value decomposition (SVD), respectively. These results are comparable to the response of biological cells (see Fig. 3 in [51]).

