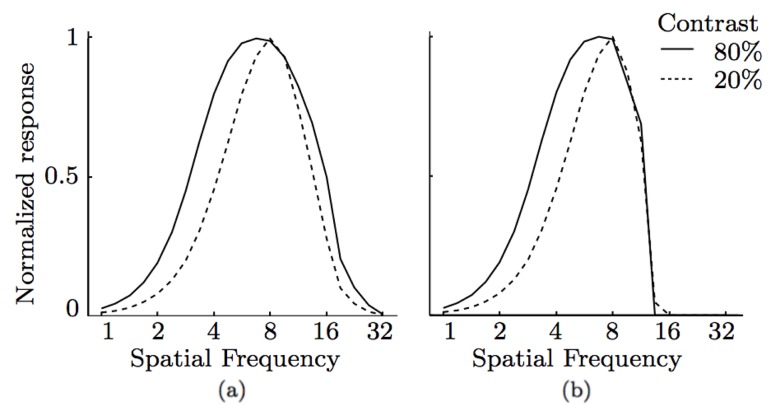
Figure 9. Spatial frequency sensitive to contrast.
Spatial frequency tuning curves as a function of contrast obtained by two CORF model cells; (a) with no inhibition ( ,
,  ) and (b) with push-pull inhibition (
 ,
,  ). The dependence of spatial frequency tuning and contrast changes is achieved only when the model LGN cells are processed by a sigmoid function.

