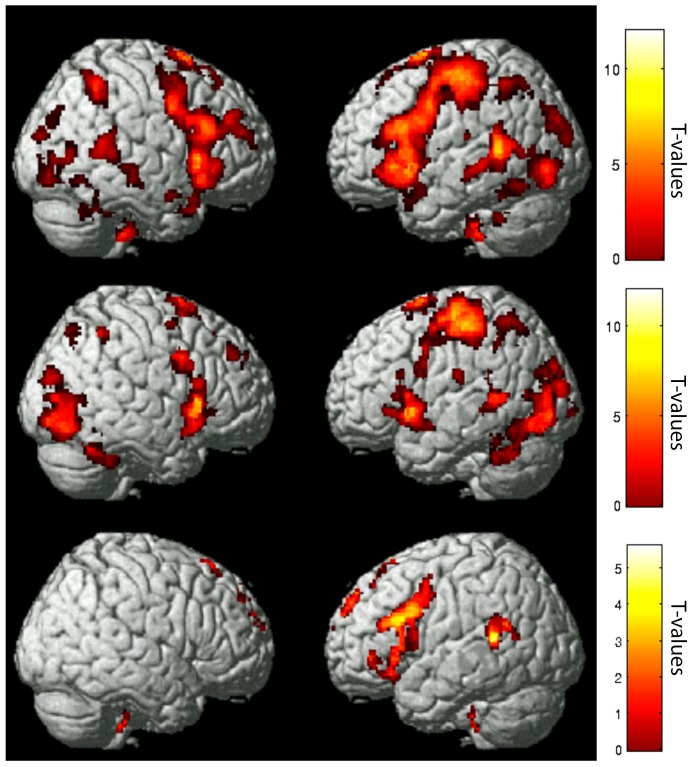
Figure 1. Sentence presentation rate differentially impacts brain activation by group.
Fast > Medium > Slow parametric modulation (cluster level FDR corrected) for a) Typical Reader Group (p<.001) (top panel); b) Dyslexic Group (p<.001) (middle panel); c) Typical > Dyslexic Groups (p<.01) (bottom panel). Color bar indicates T-values.

