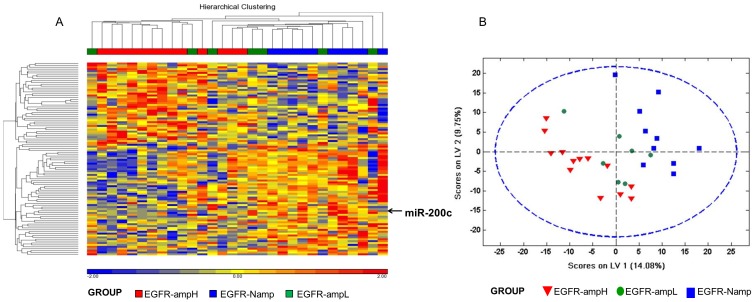
Figure 2. Microarray analysis of miRNA expression in 30 GBMs.
A. Unsupervised hierarchical clustering of GBMs (horizontal dimension) and 102 miRNAs (vertical dimension) derived from a variance analysis. Over-expressed genes are represented in red and under-expressed ones in blue. B. The projection to latent structures discriminant analysis (PLS-DA) score scatter plot of the first 2 components. This PLSDA analysis discriminates the differences between GBM with high-level of EGFR amplification (n = 13) versus GBM non-amplified EGFR (n = 10). The symbols correspond as follows: red triangle, GMB with high level of amplified EGFR samples; blue square, non-amplified EGFR samples; green circle, samples with a low level of EFGR amplification.

