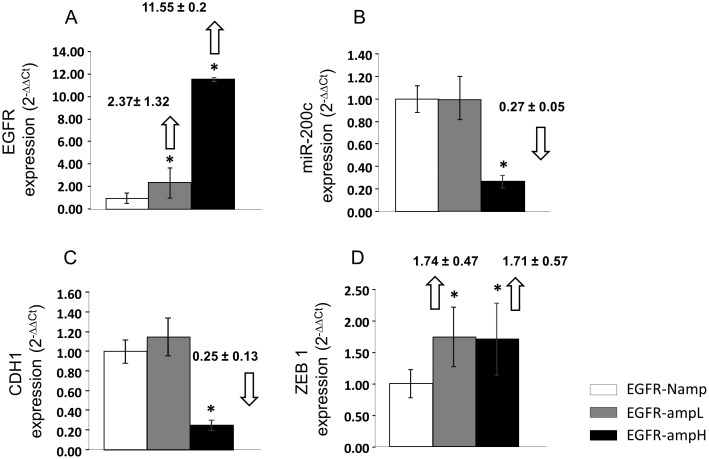
Figure 3. Real-Time RT-PCR analysis of EGFR, mir-200c, CDH1 and ZEB1 expression.
Results are representative of 30 different samples. Changes in mRNA expression are reported as mean and standard error with respect to non-amplified EGFR group using the 2−ΔΔCt method. Statistically significant expression changes (p<0.05) are marked with an *. A. EGFR mRNA expression in the GBM groups with different levels of EGFR amplification. The results were normalized to the actin housekeeping gene. B. miR-200c expression in tumor biopsies from the three studied groups. The results were normalized to the U66 housekeeping gene for miR-200c. C. CDH1 mRNA expression and D. ZEB1 mRNA expression in biopsies from the three studied groups. The results were normalized to the actin housekeeping gene.

