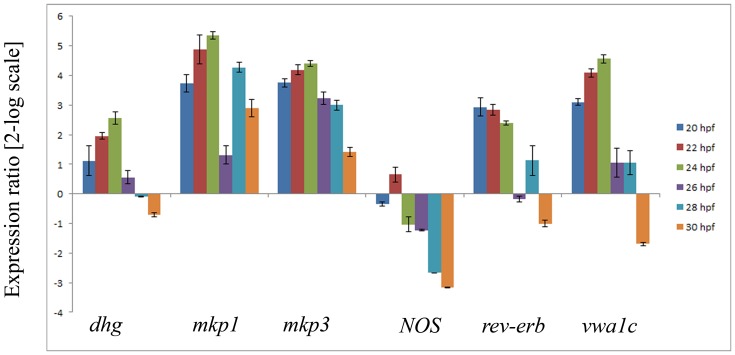
Figure 6. Gene expression profiles during larval development.
Histogram shows the values of gene expression at different times of larval development respect to those obtained for hatching larvae (18 hpf), followed by Real Time qPCR. Data are reported as a fold difference compared to the control (means ± SD). Values equal or greater than ±2 were considered significant. The experiments were repeated at least 3 times.

