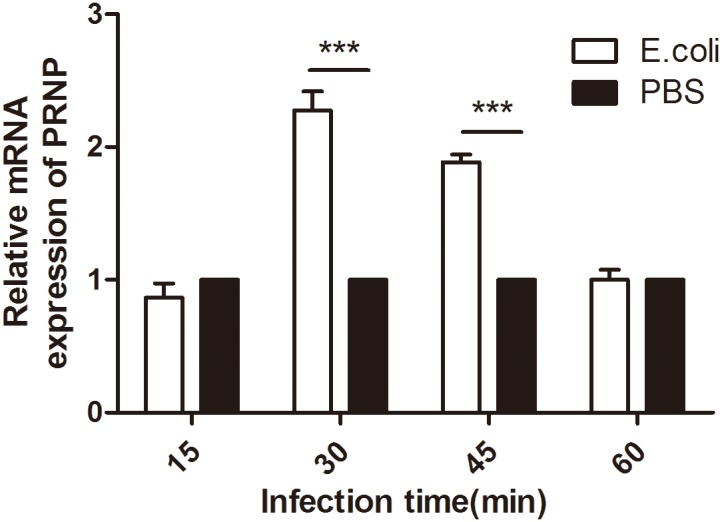
Figure 1. Quantitative PCR analysis of the effects of E. coli infection on PRNP mRNA levels in macrophages collected from wild-type mice.

Murine bone marrow-derived macrophages were exposed to E. coli at an MOI of 10. Total RNA was collected at the indicated times, reverse transcribed into cDNA, and subjected to qPCR analysis. The expression of PRNP at each time point is expressed as the fold change relative to PRNP mRNA levels in control cells exposed to PBS only. Data are the mean ± SD of triplicate samples. **p≤0.01, ***p≤0.001.
