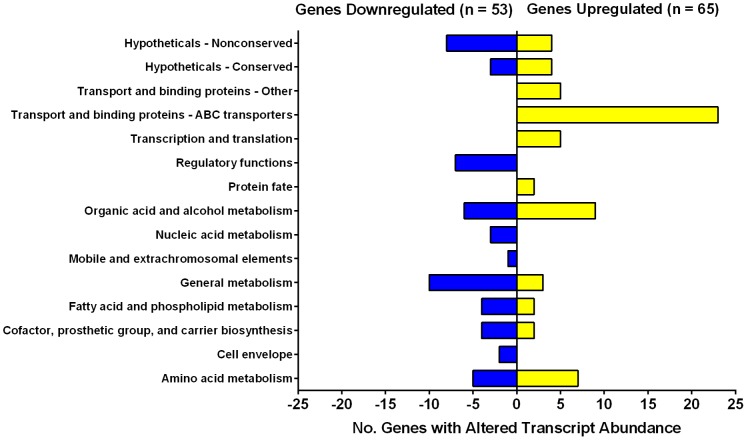
Figure 3. Genes with significant changes in expression in Δhyd2 vs. wild-type cells.
Both strains were grown synchronously on HdB minimal medium supplemented with 22>2.0, p value≤0.05. The genes were classified as significantly downregulated if expression ratio <0.5, p value≤0.05. The number of genes affected are listed by functional category. The full list of genes in each category is shown in Table S4, Table S5, and Dataset S1.

