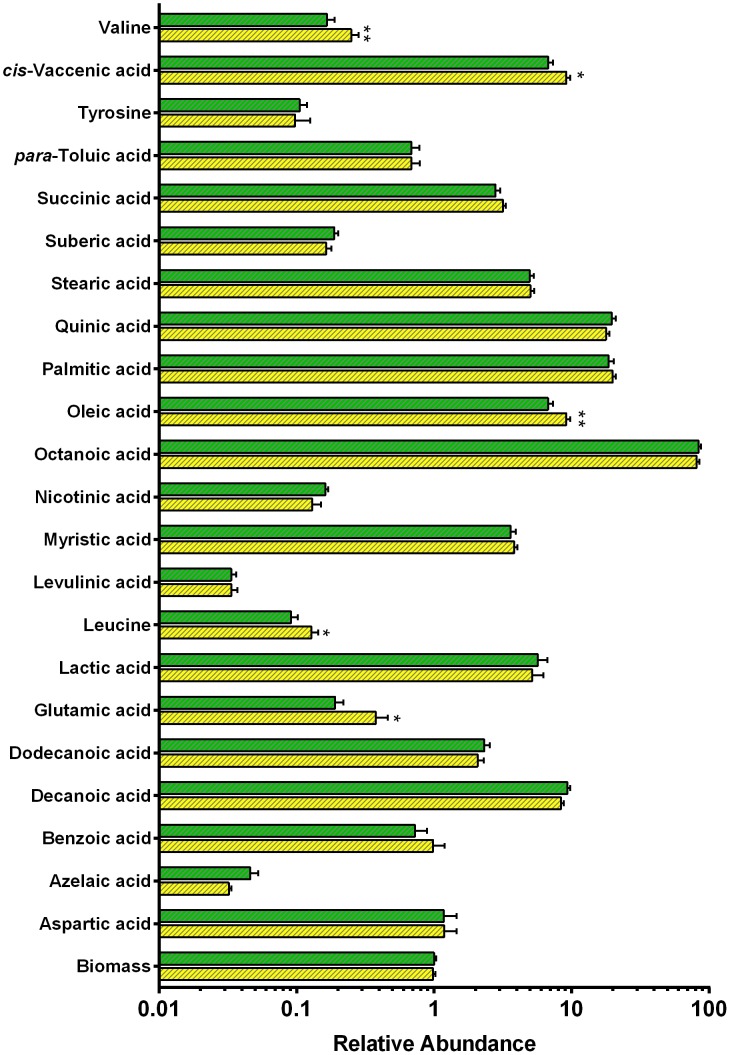
Figure 4. Profiles of intracellular metabolites in Δhyd2 vs. wild-type cells.
Metabolites were detected by gas chromatography-mass spectrometry (GC/MS). The values show the relative abundance of each metabolite detected in the samples (arbitrary units) on a logarithmic scale. Legend: Green = Wild-type, Yellow = Δhyd2. Means were calculated from three biological replicates and five technical replicates for each strain. p values were determined using a Student’s T-test. * = p<0.05, ** = p<0.01 difference relative to wild-type bars.

