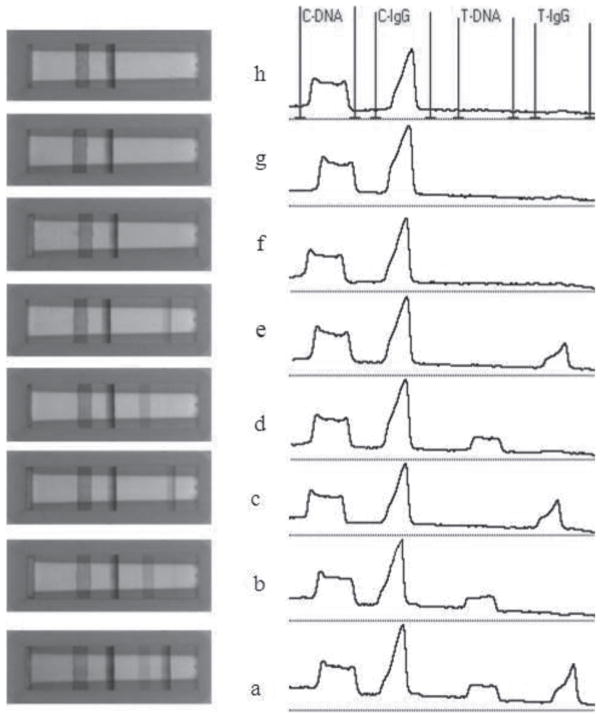
Fig. 2.
Typical photo images (left) and corresponding optical responses (right) of the red bands (control lines and test lines) on the LFD after applying different sample solutions. The responses were obtained by reading the intensities of the red bands on the test zones and control zones with a portable strip reader. The concentrations of DNA and IgG in the sample solutions are: (a) 100 nM complementary DNA + 100 ng mL−1 R-IgG, (b)100 nM complementary DNA + 0 ng mL−1 R-IgG, (c) 0 nM complementary DNA + 100 ng mL−1 R-IgG, (d) 100 nM complementary DNA + 0 ng mL−1 R-IgG + 1000 ng mL−1 BSA, (e) 0 nM complementary DNA + 100 ng mL−1 R-IgG + 1000 nM noncomplementary DNA, (f) 1000 ng mL−1 BSA + 0 nM complementary DNA + 0 ng mL−1 R-IgG, (g) 0 nM complementary DNA + 0 ng mL−1 R-IgG + 1000 nM noncomplementay DNA, (h) 0 nM complementary DNA + 0 ng mL−1 R-IgG. The sample solution was prepared using 10× SSC buffer containing 1% BSA. Volume of the sample solution: 130 μL; assay time: 15 min.

