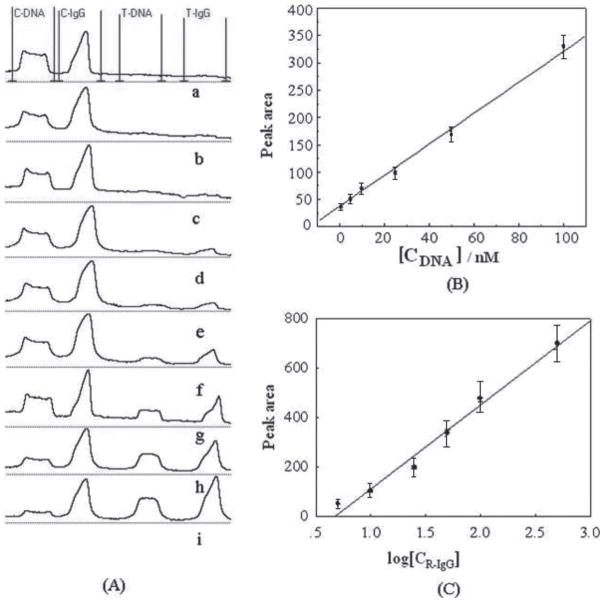
Fig. 4.
Analytical performances of the LFD. (A) The typical responses of the LFD with increasing DNA and protein concentrations. From curve a to i, the concentrations of target DNA (nM) and IgG (ng mL−1) are 0, 1, 5, 10, 25, 50, 100, 500, 1000. (B) The resulting calibration curve of DNA test. (C) The resulting calibration curve of R-IgG test. Error bars represent standard deviation, n = 6. Other conditions are the same as in Fig. 2.

