
Figure 1.
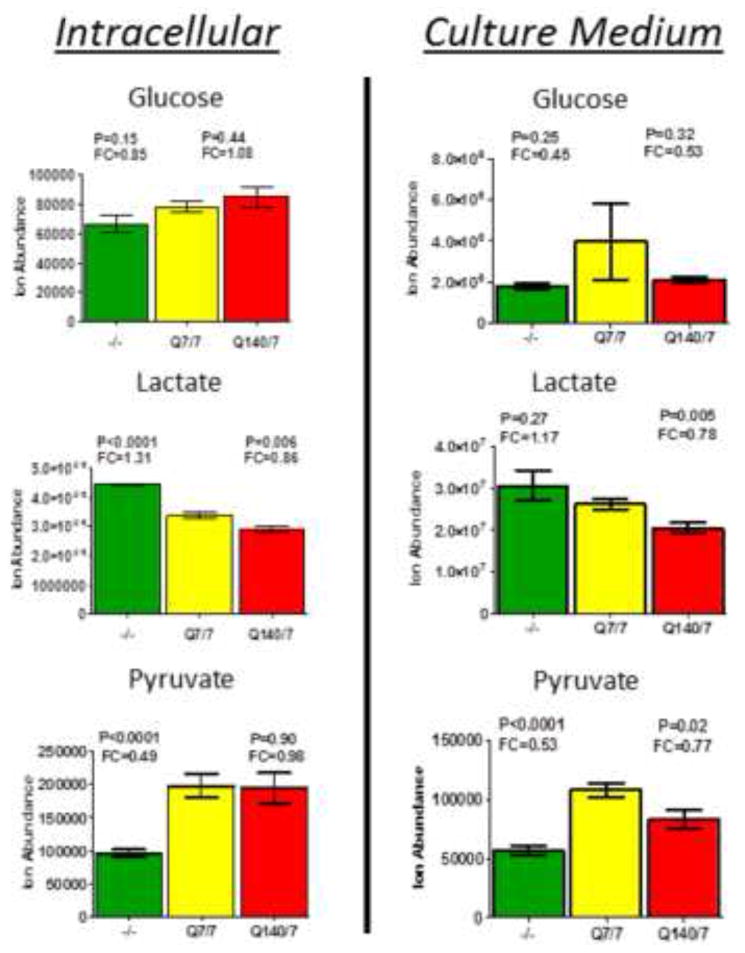
Measurement of relative levels of glucose, lactate and pyruvate in cells and cell culture medium indicates an increased rate of glycolysis in htt-/- mESCs, but no significant effect of Htt-Q140/7 mutation. Bars depict relative ion abundances measured by LC-MS for the indicated metabolites, measured both in cells (left panels) and in culture media (right panels). Observed fold-changes and p-values are quantified for htt-/- mESC (green bars) and Htt-Q140/7 mutant mESC (red bars), in comparison with wildtype Htt-Q7/7 mESC (yellow bars). Error bars are SEM.