
Figure 5.
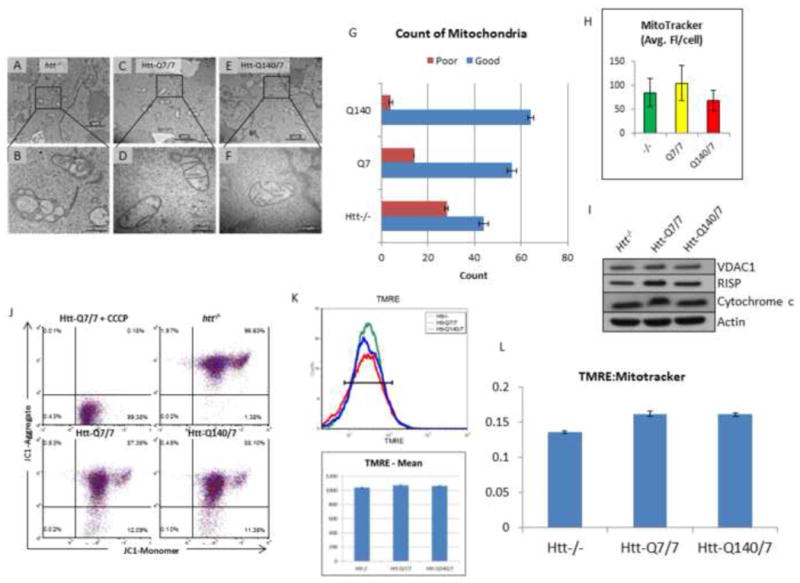
Mitochondrial EM structure is profoundly aberrant in htt-/-, relative to Htt-Q7/7 mESCs, whereas neither mitochondrial abundance nor membrane potential is significantly affected. (A-F) EM images at 15000X (top panels), and 60000X (bottom panels) comparing htt-/-(A-B), Htt-Q7/7 (C-D), and Htt-Q140/7 (E-F) mESC. Results reveal profound structural aberrations in htt-/- mESC, indicative of loss of inner membrane cristae. Scale bars are shown at lower right. (G) Counts from EM images of healthy (Good) and unhealthy (Poor) mitochondria show htt-/- mESC have more poor quality mitochondria. Mitochondria were counted in a blind manner. Error bars are standard deviation. (H) Relative mitochondrial abundance in htt-/- and Htt-Q140/7 mESCs, compared with wildtype Htt-Q7/7 mESCs, expressed on a per cell basis. Selective staining with MitoTracker red fluorescent dye, followed by FACS analysis was used to assess relative mitochondria abundance. Fluorescence values are given as mean values +/- SD. Notably, MitoTracker fluorescence was indistinguishable for all three htt mESC lines tested. (I) Equivalent mitochondrial abundance is shown by western blot analysis of whole cell lysate of htt-/-, Htt-Q7/7, and Htt-Q140/7 for the micochondrial protein VDAC1, Cytochrome b-c1 subunit RISP, and Cytochrome c. Equal amounts of protein were loaded and Actin were used controls. (J) Mitochondria from htt-/- mESC are polarized like mitochondria from Htt-Q7/7 and Htt-Q140/7 mESCs. FACS analysis assessed mitochondria potential after staining htt-/-, Htt-Q140/7 and Htt-Q7/7 mESCs with the mitochondrial voltage-sensitive fluorescent dye, JC-1. Negative control with the mitochondrial uncoupling agent CCCP depicts fluorescence spectral changes that occur when the mitochondrial potential was eliminated. Notably, JC-1 fluorescence results reveal polarization of mitochondria in all 3 htt lines. (K) Mitochondria from htt-/- mESC are polarized like mitochondria from Htt-Q7/7 and Htt-Q140/7 mESCs. FACS analysis assessed mitochondria potential after staining htt-/-, Htt-Q140/7 and Htt-Q7/7 mESCs with the mitochondrial voltage-sensitive fluorescent dye, TMRE. (L) The ratio of polarization to the number of mitochondria is roughly equivalent between htt-/-, Htt-Q7/7 and Htt-Q140/7. Intensity levels of TMRE were divided by the intensity levels of MitoTracker.