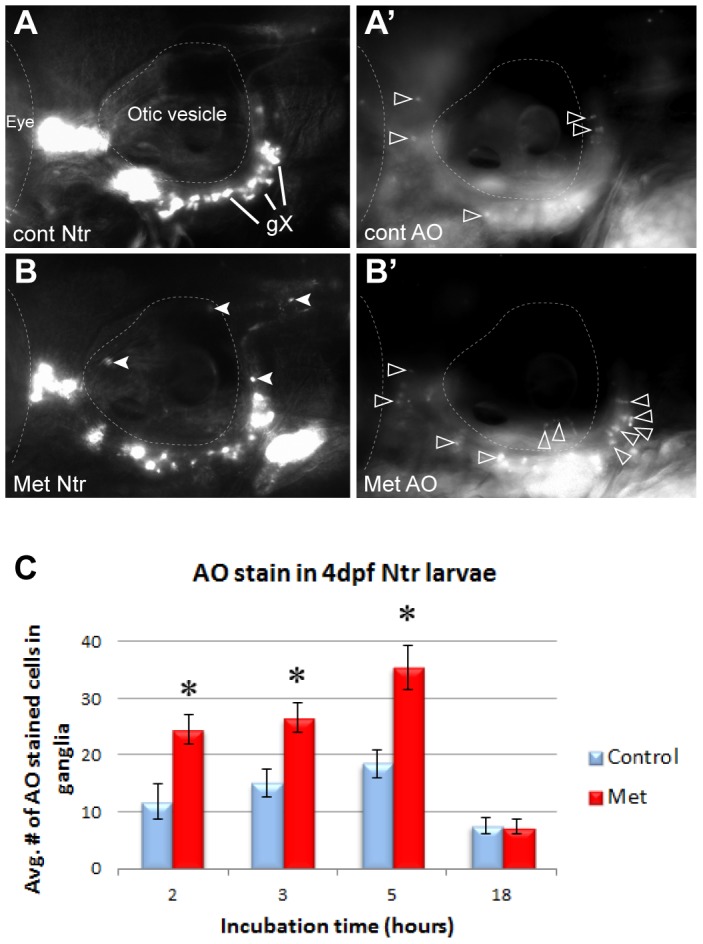
Figure 3. Metronidazole caused neuronal cell death in Ntr-expressing cells.

A) 4 dpf Ntr incubated in fish water (control) for 5 hr, followed by A’) staining and imaging with Acridine Orange (AO). AO-stained cells indicated with open arrowheads. B) 4 dpf Ntr treated with 10 mM Met for 5 hr (closed arrowheads indicate puncta in axons and debris containing mCherry), followed by B’) AO staining and imaging. Open arrowheads indicate AO stained cells. C) 4 dpf Ntr treated with 10 mM Met for various times, followed by AO staining, imaging, and counting in the ganglia. Graph indicates the average number of AO-stained cells in the ganglia for each treatment group at 2 h (control 11.75±3.14 cells, n = 12 and Met 24.54±2.67 cells, n = 24, p<0.05), 3 h (control 15.05±2.35 cells, n = 20 and Met 26.55±2.61 cells, n = 29, p<0.05), 5 h (control 18.44±2.35 cells, n = 16 and Met 35.48±3.85 cells, n = 24, p<0.05), and 18 h (control 7.54±1.4 cells, n = 21 and Met 7.46±1.22 cells, n = 21, ns). There was a significant increase in cell death during the first few hours in Met (2–5 hr), but not after 18 hr. ns, not significant.. For each image, anterior is to the left; dorsal is at the top. Eye and otic vesicle (OV) are outlined, vagal ganglia labeled gX in panel A.
