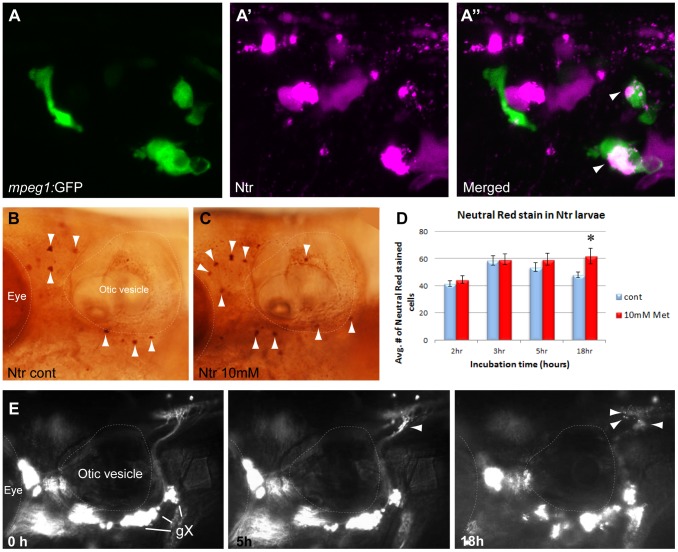
Figure 6. Macrophage response to degenerating neurons.
A,A’,A”) 5:gfp;Ntr larvae after a 24 hr treatment with 10 mM Met. A) Green channels shows macrophages located in a gX subganglion. A’) Magenta channel shows degenerating cell bodies. A”) Merged image shows colocalization (white/pink) of debris with macrophages. B,C) Neutral Red (NR) stained macrophages (arrowheads) in B) untreated or C) 3 hr Met-treated Ntr larvae at 4 dpf. D) Quantitation of NR-stained cells in 4 dpf Ntr treated with fish water (control) or 10 mM Met for various times. Graph shows average number of NR-stained cells per treatment group at 2 h (control 41.53±2.13 cells, n = 15 and Met 44.65±2.82 cells, n = 17, ns), 3 h (control 58.7±3.48 cells, n = 10 and Met 59.45±4.01 cells, n = 11, ns), 5 h (control 53.83±3.38 cells, n = 11 and Met 59.42±4.43 cells, n = 12, ns), and 18 h (control 48.00±2.24 cells, n = 18 and Met 61.86±5.85 cells, n = 14, p<0.05) Only overnight Met treatment showed a significant increase in NR staining. E) Select images from a time-lapse video of 4 dpf panther;Ntr in 10 mM Met for 18 hrs. Puncta are seen along the axons at 5 h and 18 h (arrowheads). No other motile cells are seen surrounding the axons or ganglia. For all panels, anterior is to the left; dorsal is at the top. Eye and otic vesicle (OV) are outlined. Vagal ganglia labeled gX in panel E.

