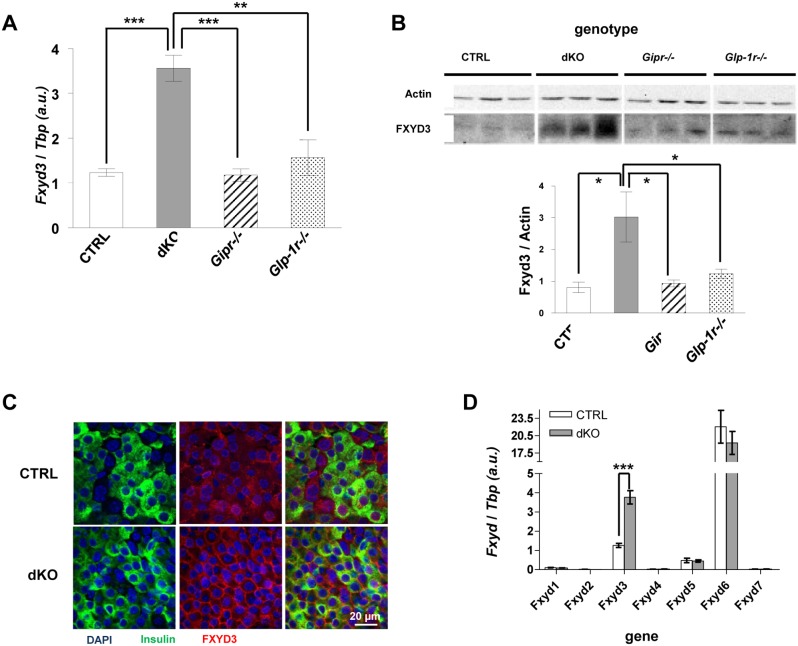
Figure 1. Fxyd3 is overexpressed in dKO islets.
(A) Fxyd3 mRNA level in primary islets from control (CTRL), dKO, Glp1r−/− or Gipr−/− mice. Data are mean ± sem, n = 4–5; **p<0,01, ***p<0,001. (B) Western blot analysis and quantification of Fxyd3 expression in primary islets from CTRL, dKO, Glp1r−/− and Gipr−/− mice. Data are mean ± sem, *p<0,05, n = 4–5. (C) Confocal immunofluorescence microscopy detection of insulin and Fxyd3 in CTRL and dKO islets cultured on ECM plates. (D) Quantitative RT-PCR analysis of Fxyd family members expression in control and dKO islets. Data are mean ± sem n = 4–5, ***p<0,001 compared to CTRL.

