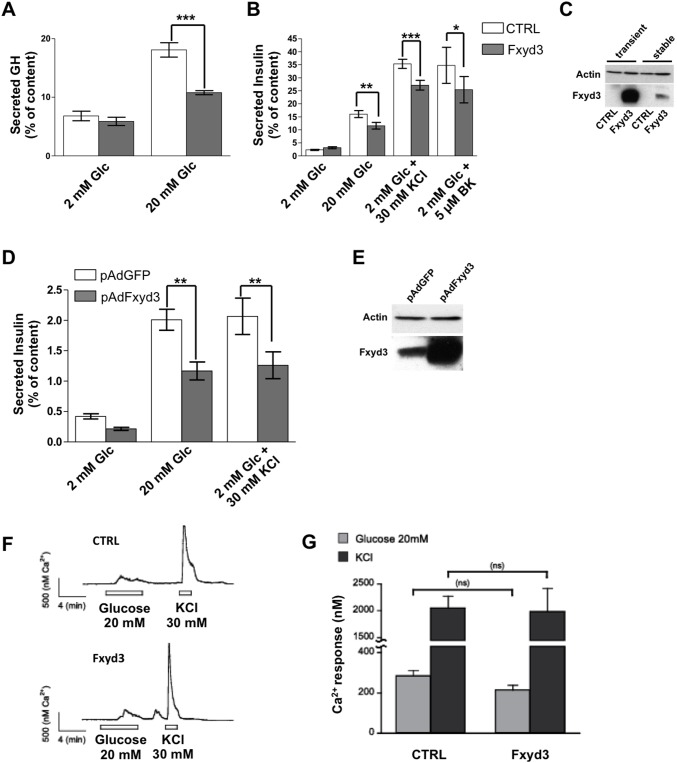
Figure 2. Fxyd3 overexpression impairs glucose stimulated insulin secretion in MIN6 cells and primary beta.-cells.
(A) MIN6 cells were transiently transfected with a control or Fxyd3 expression plasmid and a plasmid for expression of hGH. Secretion of hGH was then measured at the indicated glucose concentrations. Data are mean ± sem; n = 5 experiments realized in triplicates, ***p<0,001. (B) MIN6 cells stably transfected with a control or Fxyd3 expressing construct were exposed to the indicated concentrations of glucose, KCl or the calcium channel agonist BayK8644. Insulin and hGH secretions were measured in control and Fxyd3 over-expressing cells/islets in multiple experiments. A two-way anova with repeated measurements (pairing each experiment) with post hoc Bonferroni test was used to compare the groups. Data are mean ± sem, n = 10 experiments realized in triplicates, *p<0,05 **p<0,01 ***p<0,001. (C) Western blot analysis of Fxyd3 expression in transiently or stably transfected MIN6 cells. (D, E) Primary islets were isolated from control mice and infected either with LacZ or Fxyd3 adenoviruses. Islets were challenged with the indicated glucose and KCl concentrations. Data are mean ± sem; n = 7 experiments realized in triplicates; **p<0,01). (E) Western blot analysis of Fxyd3 expression in control and Fxyd3 adenoviruses infected islets. (F and G) Intracellular calcium concentrations measured using the Fura2 ratiometric method. Stably control- or Fxyd3-transduced MIN6 cells were superfused with 2 or 20 mM glucose and 30 mM KCl as indicated. (J) Quantification of the calcium response. Data are mean ± sem, n = 20 per group.

