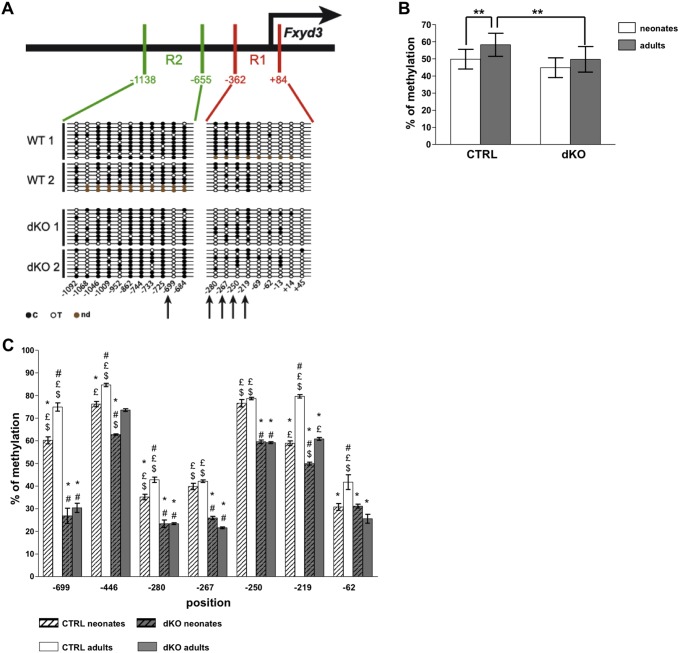
Figure 4. Differential methylation of the Fxyd3 promoter in control and dKO islets.
(A) Upper part: schematic representation of the Fxyd3 promoter and the R1 and R2 regions that have been analyzed by sequencing following bisulfite conversion of cytosines. Lower part: schematic representation of the cytosines that were methylated (black dots), not methylated (circles) or not determined (brown dots). (B, C) DNA was prepared from control and dKO adult or neonates islets. Following bisulfite treatment, pyrosequencing was performed to quantitate the methylation of individual CpGs. (B) Global promoter methylation in neonate and adult islets. These data were derived from the calculated means of the percent methylated CpG at each position and for each group of mice. These means were compared for each position between groups using a two-way anova with repeated measurements with post-hoc Tukey test. Data are mean ± sem, n = 6–12 islet preparations; **p<0,01. (C) Quantitative methylation of seven CpGs in islets of control and dKO neonate and adult mice. Data are mean ± sem, n = 6–12 islet preparations; statistics are: #p<0.05 when compared to CTRL neonates (white dashed bars); *p<0.05 when compared to CTRL adults (white bars); £ p<0.05 when compared to dKO neonates (grey dashed bars) and $ p<0.05 when compared to dKO adults (grey bars).

