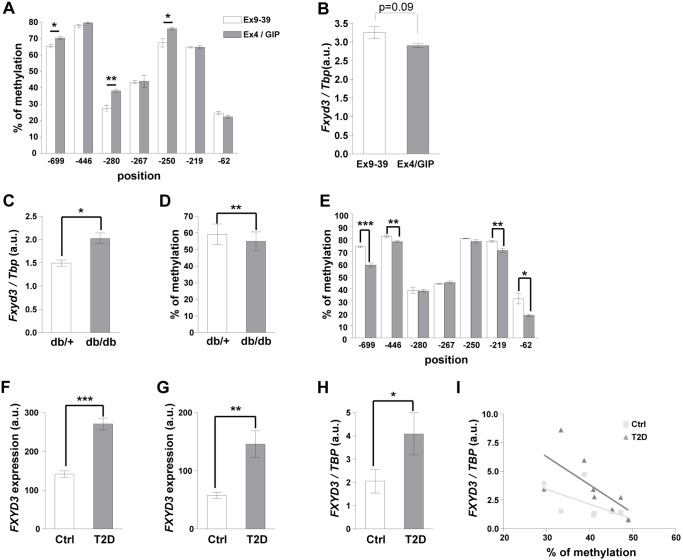
Figure 6. Fxyd3 promoter methylation in neonates and in diabetic mouse and human islets.
(A) Ctrl neonates received daily injections for 7 days of Ex9–39 (2,5 nmol/kg) or Ex4 (2,5 nmol/kg) and GIP (80,4 nmol/kg). Methylation of CpG sites was determined by pyrosequencing. Data are mean ± sem, n = 3 experiments, *p<0,05, **p<0,01 as compared to control. (B) Fxyd3 mRNA expression in islets prepared as in (A). Data are mean ± sem, n = 4 experiments. (C) Fxyd3 mRNA expression in islets from db/+ and db/db mice. These data were derived from the calculated means of the percent methylated CpG at each position and for each group of mice. These means were compared for each position between groups using a paired t-test. Data are mean ± sem, n = 4, *p<0,05. (D) Pyrosequencing analysis of global Fxyd3 promoter methylation in islets from db/+ and db/db mice. Data are mean ± sem, n = 4, **p<0,01. (E) Pyrosequencing analysis of the methylation of individual CpGs. Data are mean ± sem, n = 4, *p<0,05, **p<0,01, ***p<0,001. (E, F) FXYD3 expression in human islets assessed by Affymetrix chip analysis (F), probeset g13528881_3p_a_at; (G), probeset g11612675_3p_a_at. Data are mean ± sem, n = 10 per group, **p<0,01 and ***p<0,001 compared to controls. (H) FXYD3 mRNA expression measured by real-time PCR using a separate set of control (n = 8 donors) and T2D (n = 8 donors) humans islets. Data are mean ± sem, *p<0,05. (I) Inverse correlation of CpG -43 methylation and Fxyd3 expression in islets from Ctrl and T2DM patients.

