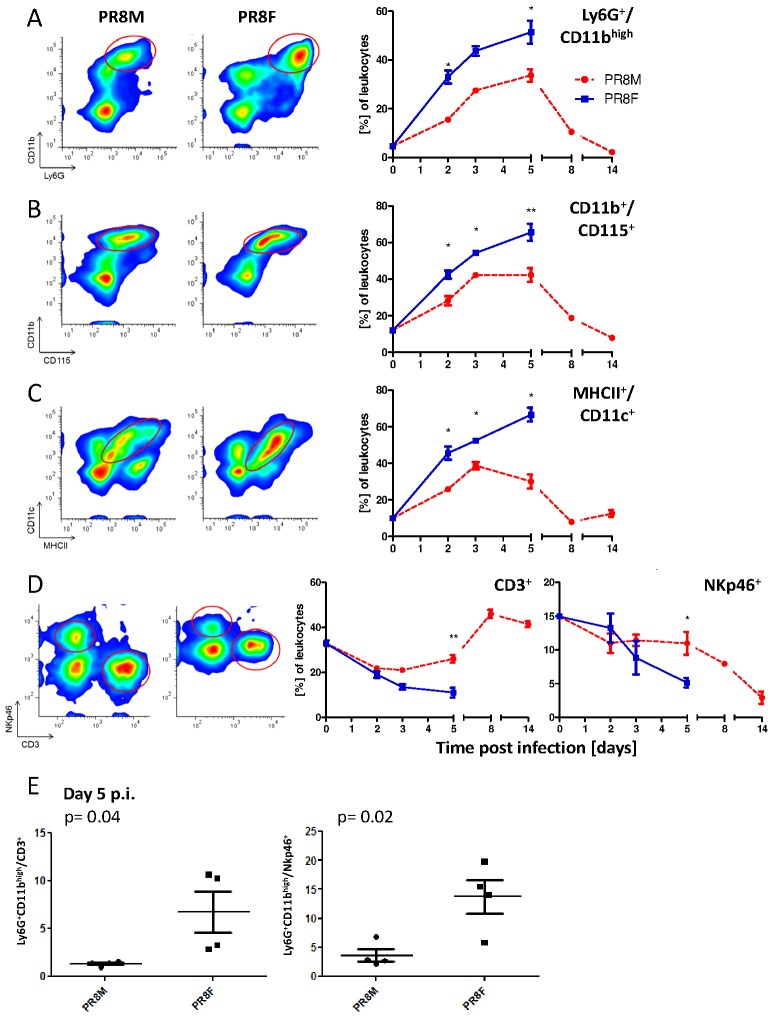
Figure 4. Flow cytometric analyses revealed quantitative and qualitative differences of the host response to PR8M versus PR8F infection.
Lungs from infected C57BL/6J mice (2×10³ FFU) were extracted and cell suspensions were analyzed by flow cytometry on days 0, 2, 3, 5, 8 and 14 p.i. After excluding dead cells and gating on leukocytes (CD45+), four combinations of fluorochrome-labeled antibodies were used to differentiate various immune cell populations: CD11b+Ly6G+ (granulocytes, A); CD11b+CD115+ (macrophages, B); CD11c+MHCII+ (dendritic cells, C); NKp46+ and CD3+ (NK and T cells, D). The left panel illustrates the results of day 3 p.i. and indicates the population analyzed in the right panel. The right panel shows percentage of individual cell populations over time (mean±SEM). For each measurement two to three lungs were pooled and data from two independent experiments were combined (n = 3–6). Data were analyzed for statistically significant differences using non-parametric Mann-Whitney-U-test. *: p-value<0.05; **: p-value<0.01. Ratios of Ly6G+CD11bhigh cells (granulocytes) vs. T cells (CD3+) or NK cells (NKp46+) in PR8M and PR8F infected mice revealed significant differences (p value as indicated) on day 5 p.i. (E).

