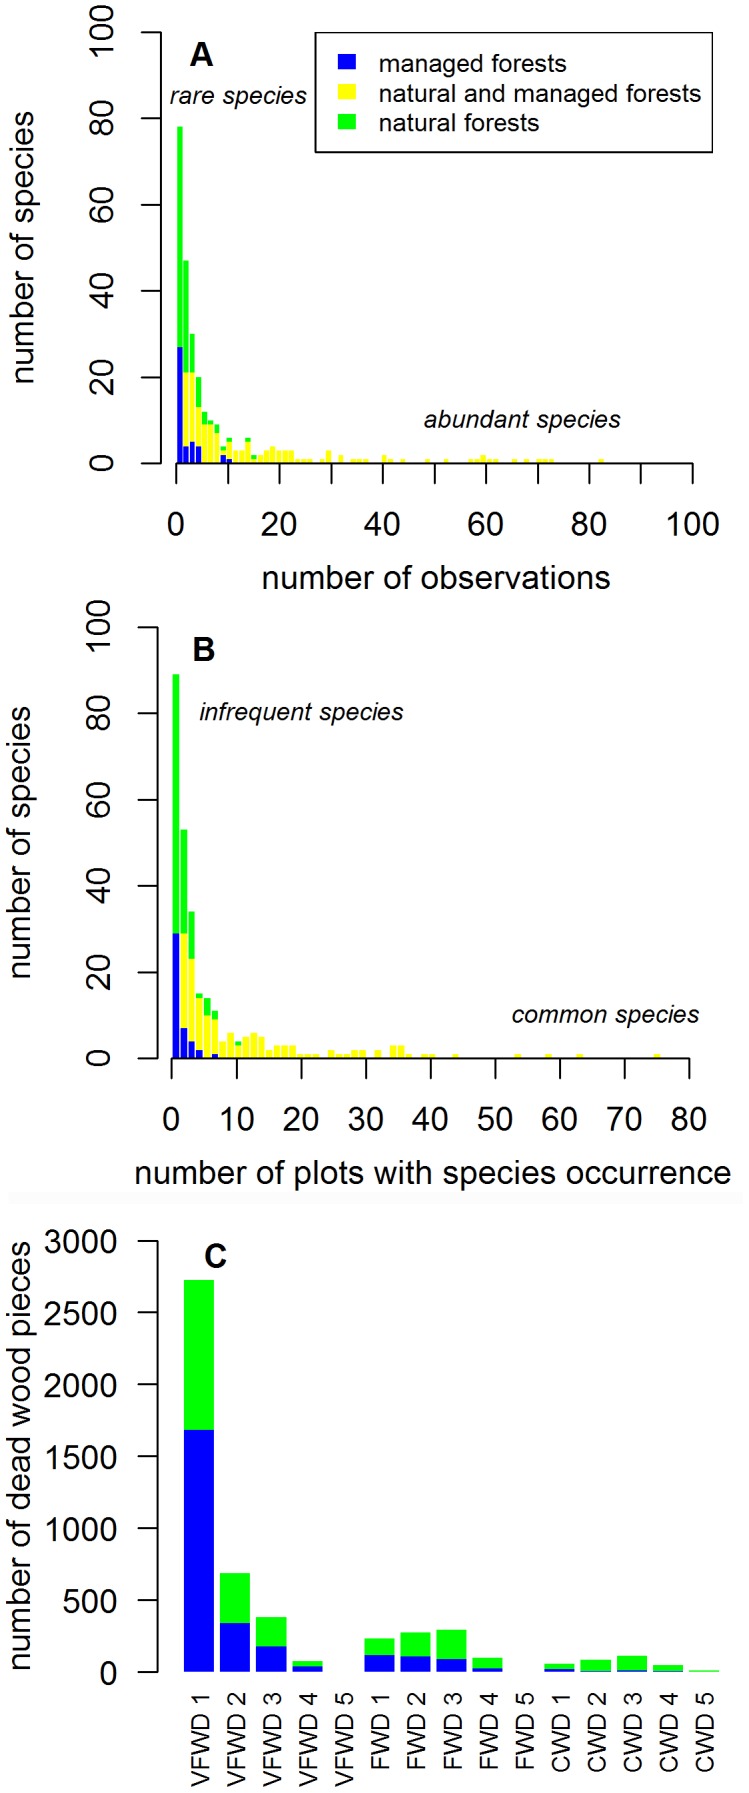
Figure 1. The abundance distributions of species and dead wood types.

The total number of occurrences of each species (Panel A), the number of plots in which each species was recorded (Panel B) and the number of occurrences of each dead wood type (Panel C). The species and dead wood pieces that were recorded in managed forests are represented with blue colour, those that were recorded in natural forests with yellow colour, and those species recorded in both forest types with green colour.
