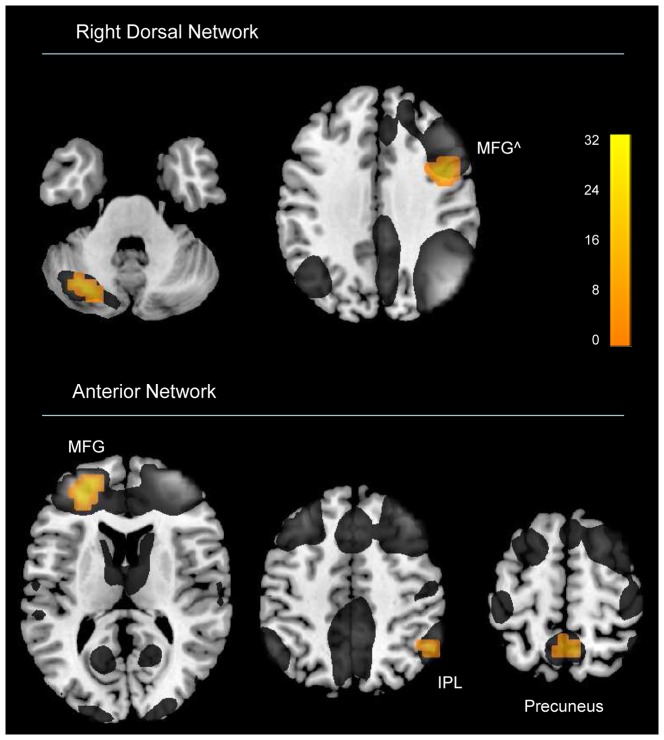
Figure 2. Sex differences in fronto-parietal networks.
Main effect of sex was found for two networks. Results are uncorrected (p<0.00025), cluster size 10, projected onto a standard brain template. Right dorsal network (z = −35, 36); Anterior network (z = 12, 48 and 62). Yellow blobs represent areas of higher connectivity for women relative to men; gray represents overlaid maps of the respective independent components. Abbreviations: MFG – middle frontal gyrus, IPL – inferior parietal lobe. ∧ significant when brain volume correction is left out.

