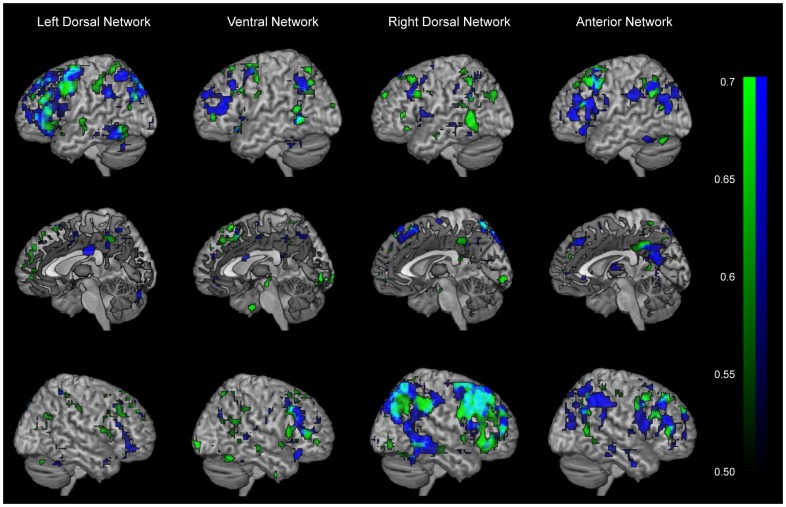
Figure 3. Test-retest reliability analysis.
Rendered ICC maps in left, medial, and right hemispheric view for men (blue) and women (green) calculated for the four frontoparietal networks: Left dorsal; Ventral; Right dorsal; Anterior network. The overlapping ICC maps between men and women are shown in turquoise. Depicted are voxels which survived the correlation threshold of r = .50. The colour range represents correlational values from .50 (darkest) to .70 and above (lightest).

