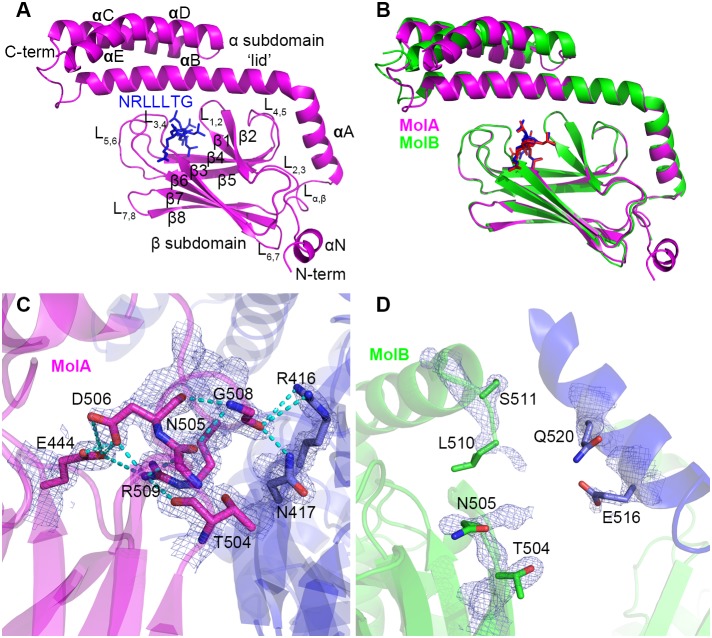
Figure 1. Overall structure of the human peptide-bound HSP70 SBD.
A. Cartoon representation of NRLLLTG-bound HSP70 SBD Molecule A. The SBD and NRLLLTG peptide are shown in magenta and blue, respectively, and all domains and secondary structural elements are labeled. B. Superposition of molecules A and B in the asymmetric unit cell. Molecules A and B are color-coded magenta and green, respectively. C and D. Hinge region between the α and β subdomains. Molecules A and B are shown in panels C and D, respectively. Interacting (MolA) or potential interacting (MolB) residues are indicated in stick and CPK coloring (oxygen in red and nitrogen in blue). The electron density maps corresponding to these residues are contoured at 1.5 (MolA) and 1.0 (MolB) sigma. Hydrogen bonds are indicated with dotted lines.

