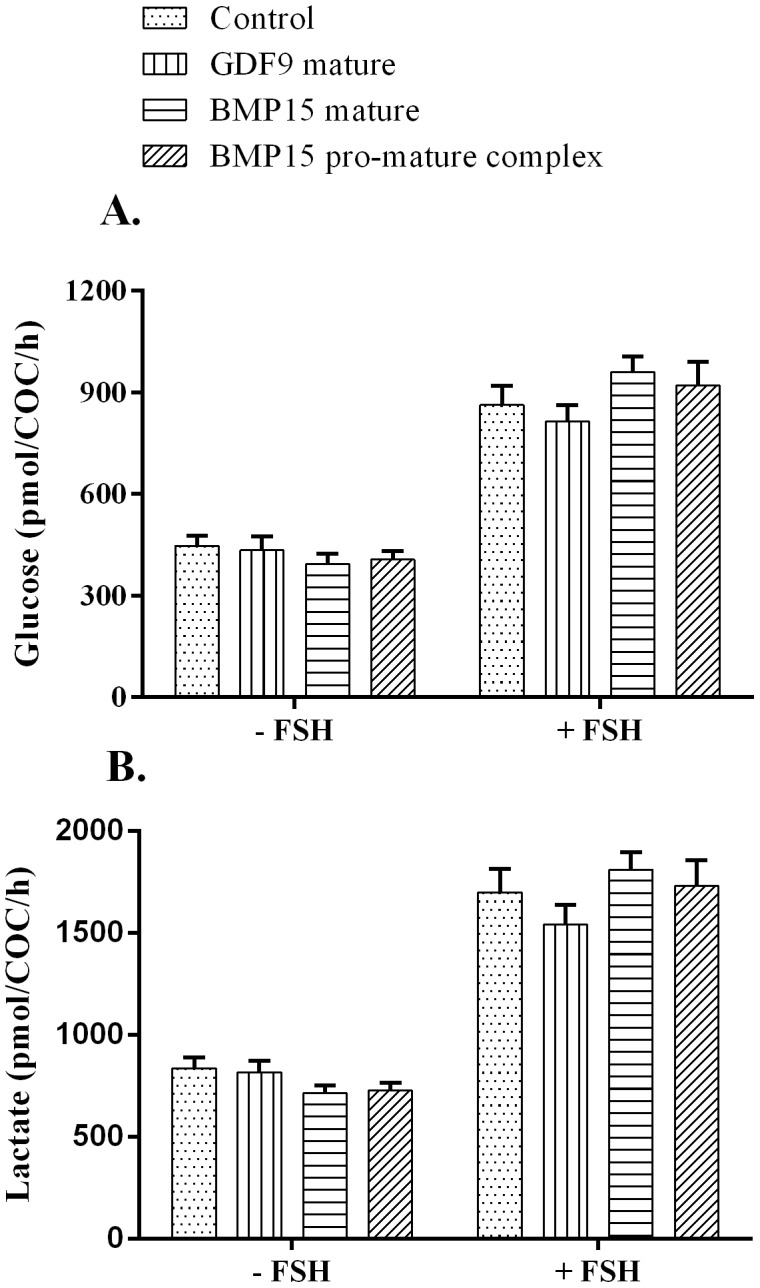
Figure 3. COC glucose consumption and lactate production.

Spent IVM medium were analysed for glucose and lactate levels post 23(mature BMP15 and pro-mature BMP15) or mature GDF9 at 100 ng/ml, in the absence or presence of FSH. A. Glucose uptake. B. Lactate production. Bars represent the mean ± SEM. Data were derived from 12 independent replicates for each treatment.
