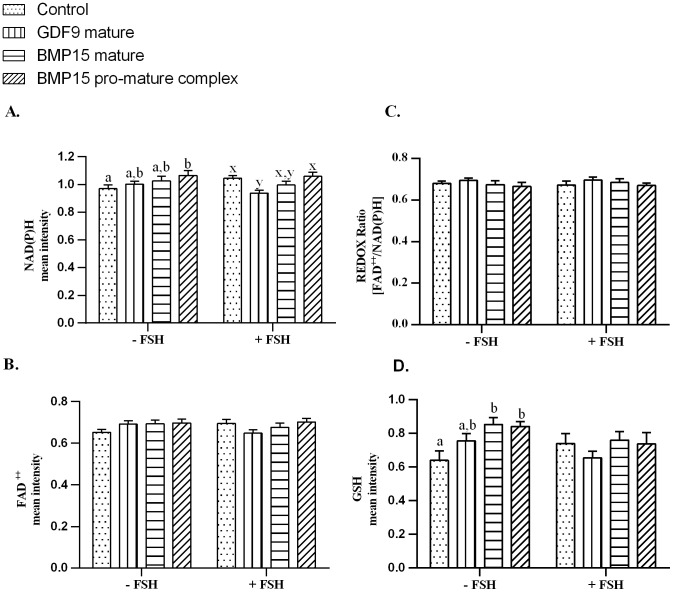
Figure 4. Quantification of intra-oocyte NAD(P)H, FAD, REDOX ratio and GSH.
Effect of treatment of intact COCs with different forms of BMP15 (mature BMP15 and pro-mature BMP15) or mature GDF9 at 100 ng/ml, +/− FSH on intra-oocytemetabolic activity. A. Autofluorescence of NAD(P)H. B. Autofluorescence of FAD. C. REDOX ratio (FAD/NAD(P)H). D. GSH levels. Bars represent the mean ± SEM. Data were derived from 4 independent replicates for autofluorescence on intra-oocyte NAD(P)H, FAD, and REDOX ratio and 3 independent replicates for GSH levels. Columns with different superscripts are significantly different (P<0.05); a,bminus FSH, x–yplus FSH.

