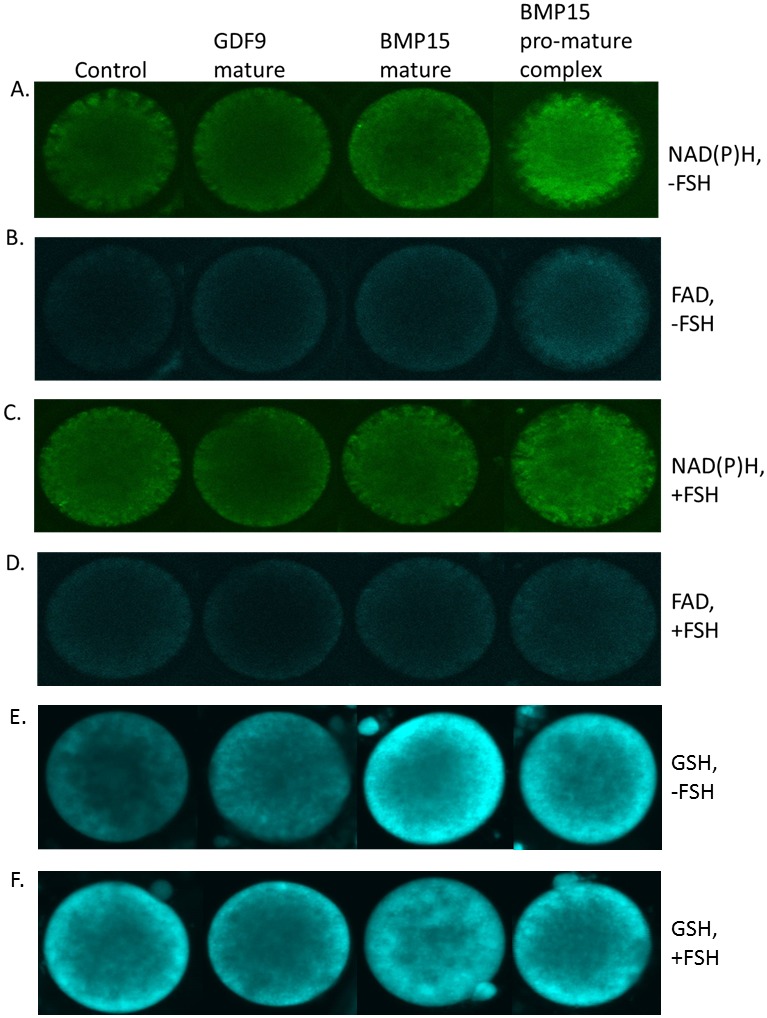
Figure 5. Representative micrographs of intra-oocyte NAD(P)H (A, C) and FAD (B, D) autofluorescence and GSH fluorescence (E, F), after treatment with different forms of BMP15 (mature BMP15 and pro-mature BMP15) or mature GDF9 at 100 ng/ml, in the absence (A, B, E) or presence (C, D, F) of FSH.