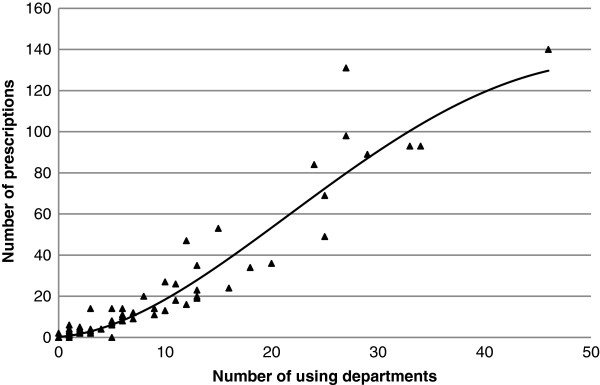
Figure 3.

Correlation between medicines exposure at unit and individual levels. Number of units using each specified active ingredient (n = 99) in relation to the number of prescriptions in the PPS was observed. Polynomial regression trendline for active ingredients used in more than one unit in the SES is shown. √number of prescriptions = 0.421 *(number of departments) – 0.004 *(number of departments)2 + 0.485; R2 = 0.93.
