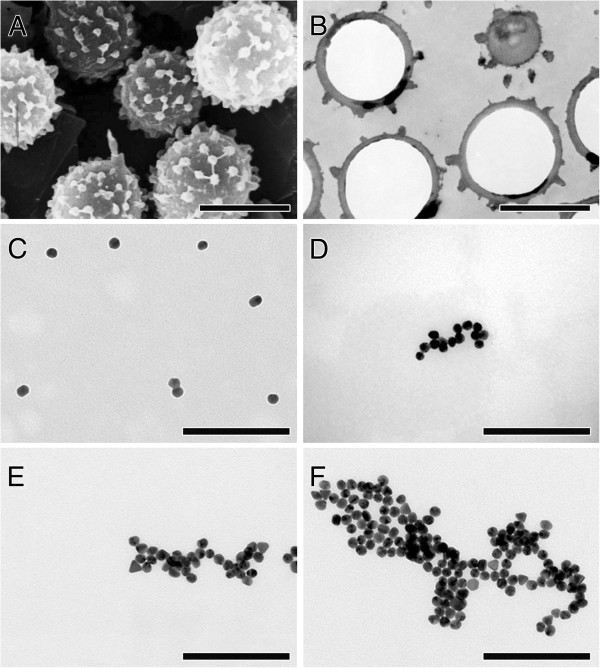
Figure 2.

Electron micrographs of micro- and nanoparticles. (A) Scanning electron micrograph of sphere-shaped fungal spores with spikes. (B) Transmission electron micrograph of ultrathin section of epon-embedded spores. (C-F) Transmission electron micrographs of AuNP in serum-free D-MEM: (C) single NP and small cluster of two NP, (D-F) NP clusters of various sizes. Bars: (A, B) = 3 μm; (C-F) = 200 nm.
