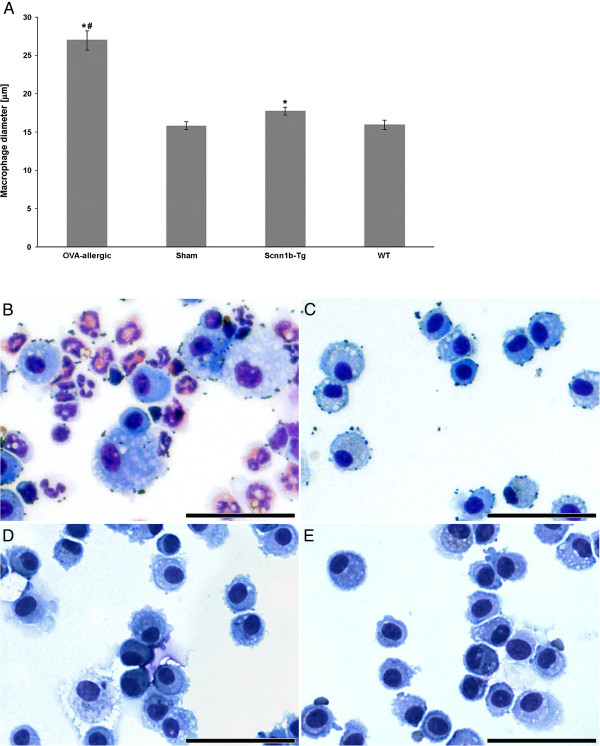
Figure 3.

Size distribution and morphology of macrophages. (A) Size distribution of macrophages: Data are expressed as mean values ± SEM per animal group; *significant difference to corresponding healthy controls (P < 0.05); #significant difference to all other animal groups (P < 0.001). (B-E) Light micrographs of BAL cells: from (B) OVA-allergic and (C) sham-sensitized, (D) Scnn1b-Tg and (E) WT mice. Bars: 50 μm.
